
|
Guangdong Baolihua New Energy Stock Co., Ltd. (000690.SZ) DCF Valoración |
Completamente Editable: Adáptelo A Sus Necesidades En Excel O Sheets
Diseño Profesional: Plantillas Confiables Y Estándares De La Industria
Predeterminadas Para Un Uso Rápido Y Eficiente
Compatible con MAC / PC, completamente desbloqueado
No Se Necesita Experiencia; Fáciles De Seguir
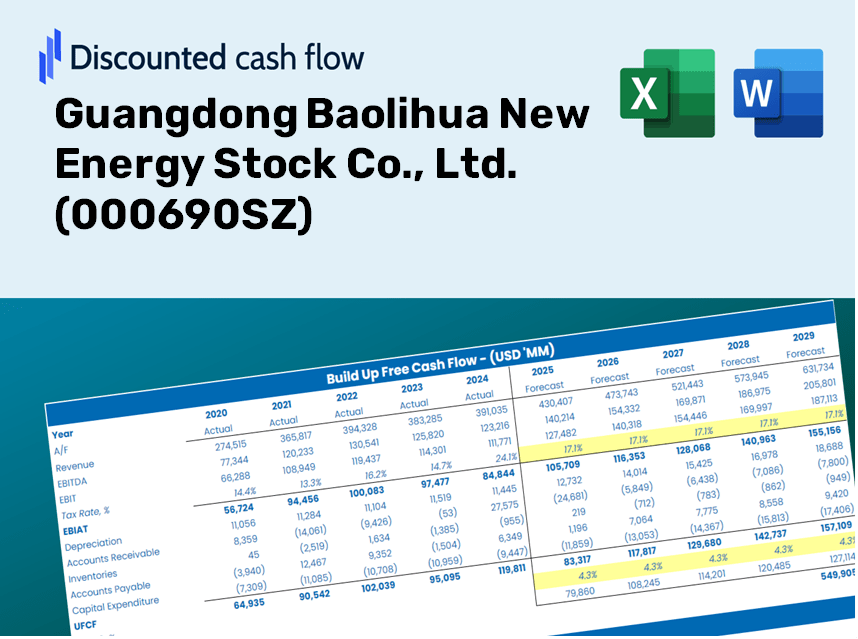
Guangdong Baolihua New Energy Stock Co., Ltd. (000690.SZ) Bundle
¡Mejore sus estrategias de inversión con la calculadora DCF Guangdong Baolihua New Energy Stock Co., Ltd. (000690SZ)! Utilice datos financieros auténticos, ajuste las predicciones y gastos de crecimiento, y observe instantáneamente cómo estas modificaciones afectan el valor intrínseco de Guangdong Baolihua New Energy Stock Co., Ltd. (000690SZ).
Discounted Cash Flow (DCF) - (USD MM)
| Year | AY1 2020 |
AY2 2021 |
AY3 2022 |
AY4 2023 |
AY5 2024 |
FY1 2025 |
FY2 2026 |
FY3 2027 |
FY4 2028 |
FY5 2029 |
|---|---|---|---|---|---|---|---|---|---|---|
| Revenue | 7,159.7 | 9,410.6 | 9,415.0 | 10,274.8 | 7,903.7 | 7,330.2 | 6,798.4 | 6,305.1 | 5,847.6 | 5,423.3 |
| Revenue Growth, % | 0 | 31.44 | 0.0462419 | 9.13 | -23.08 | -7.26 | -7.26 | -7.26 | -7.26 | -7.26 |
| EBITDA | 3,353.5 | 1,817.6 | 1,029.0 | 1,781.0 | 1,550.6 | 1,671.8 | 1,550.5 | 1,438.0 | 1,333.7 | 1,236.9 |
| EBITDA, % | 46.84 | 19.31 | 10.93 | 17.33 | 19.62 | 22.81 | 22.81 | 22.81 | 22.81 | 22.81 |
| Depreciation | 782.9 | 766.1 | 746.1 | 691.8 | 634.3 | 612.2 | 567.8 | 526.6 | 488.4 | 452.9 |
| Depreciation, % | 10.94 | 8.14 | 7.92 | 6.73 | 8.02 | 8.35 | 8.35 | 8.35 | 8.35 | 8.35 |
| EBIT | 2,570.6 | 1,051.5 | 282.9 | 1,089.2 | 916.4 | 1,059.6 | 982.7 | 911.4 | 845.3 | 784.0 |
| EBIT, % | 35.9 | 11.17 | 3 | 10.6 | 11.59 | 14.46 | 14.46 | 14.46 | 14.46 | 14.46 |
| Total Cash | 4,674.7 | 4,984.9 | 6,056.0 | 4,808.9 | 4,458.3 | 4,189.9 | 3,885.9 | 3,604.0 | 3,342.5 | 3,099.9 |
| Total Cash, percent | .0 | .0 | .0 | .0 | .0 | .0 | .0 | .0 | .0 | .0 |
| Account Receivables | 823.4 | 1,261.5 | 1,113.9 | 1,394.2 | 897.7 | 904.0 | 838.4 | 777.6 | 721.2 | 668.9 |
| Account Receivables, % | 11.5 | 13.41 | 11.83 | 13.57 | 11.36 | 12.33 | 12.33 | 12.33 | 12.33 | 12.33 |
| Inventories | 185.3 | 349.3 | 521.1 | 298.4 | 323.3 | 276.0 | 256.0 | 237.4 | 220.2 | 204.2 |
| Inventories, % | 2.59 | 3.71 | 5.53 | 2.9 | 4.09 | 3.77 | 3.77 | 3.77 | 3.77 | 3.77 |
| Accounts Payable | 513.9 | 829.5 | 610.3 | 621.8 | 506.9 | 512.2 | 475.1 | 440.6 | 408.6 | 379.0 |
| Accounts Payable, % | 7.18 | 8.81 | 6.48 | 6.05 | 6.41 | 6.99 | 6.99 | 6.99 | 6.99 | 6.99 |
| Capital Expenditure | -342.9 | -281.2 | -251.2 | -1,982.6 | -1,678.3 | -747.3 | -693.1 | -642.8 | -596.2 | -552.9 |
| Capital Expenditure, % | -4.79 | -2.99 | -2.67 | -19.3 | -21.23 | -10.2 | -10.2 | -10.2 | -10.2 | -10.2 |
| Tax Rate, % | 24.03 | 24.03 | 24.03 | 24.03 | 24.03 | 24.03 | 24.03 | 24.03 | 24.03 | 24.03 |
| EBITAT | 2,031.1 | 881.3 | 310.0 | 871.2 | 696.1 | 887.5 | 823.1 | 763.4 | 708.0 | 656.6 |
| Depreciation | ||||||||||
| Changes in Account Receivables | ||||||||||
| Changes in Inventories | ||||||||||
| Changes in Accounts Payable | ||||||||||
| Capital Expenditure | ||||||||||
| UFCF | 1,976.3 | 1,079.7 | 561.6 | -465.7 | 8.8 | 798.7 | 746.2 | 692.1 | 641.9 | 595.3 |
| WACC, % | 4.34 | 4.41 | 4.64 | 4.35 | 4.29 | 4.41 | 4.41 | 4.41 | 4.41 | 4.41 |
| PV UFCF | ||||||||||
| SUM PV UFCF | 3,077.6 | |||||||||
| Long Term Growth Rate, % | 2.00 | |||||||||
| Free cash flow (T + 1) | 607 | |||||||||
| Terminal Value | 25,219 | |||||||||
| Present Terminal Value | 20,326 | |||||||||
| Enterprise Value | 23,404 | |||||||||
| Net Debt | 2,576 | |||||||||
| Equity Value | 20,828 | |||||||||
| Diluted Shares Outstanding, MM | 2,205 | |||||||||
| Equity Value Per Share | 9.45 |
What You Will Receive
- Customizable Excel Template: A comprehensive Excel-based DCF Calculator featuring pre-filled financials for Guangdong Baolihua New Energy Stock Co., Ltd. (000690SZ).
- Genuine Data: Access to historical data and forward-looking projections (highlighted in the yellow cells).
- Adjustable Forecasts: Modify key assumptions such as revenue growth, EBITDA percentage, and WACC easily.
- Instant Calculations: Quickly observe how your inputs affect the valuation of Guangdong Baolihua New Energy Stock Co., Ltd. (000690SZ).
- Professional Resource: Designed for investors, CFOs, consultants, and financial analysts alike.
- Intuitive Layout: Organized for ease of understanding and navigation, complete with step-by-step guidance.
Key Features
- Comprehensive DCF Calculator: Features detailed unlevered and levered DCF valuation models tailored for Guangdong Baolihua New Energy Stock Co., Ltd. (000690SZ).
- WACC Analysis Tool: Offers a pre-configured Weighted Average Cost of Capital sheet with adjustable inputs for precise calculations.
- Customizable Forecast Assumptions: Easily modify growth projections, capital expenditure plans, and discount rates.
- Integrated Financial Ratios: Evaluate profitability, leverage, and efficiency metrics specific to Guangdong Baolihua New Energy Stock Co., Ltd. (000690SZ).
- Visual Dashboard and Charts: Provides graphical representations that summarize essential valuation metrics for straightforward analysis.
How It Functions
- Download: Obtain the pre-formatted Excel file containing Guangdong Baolihua New Energy Stock Co., Ltd.'s financial data.
- Customize: Modify forecasts, including revenue growth, EBITDA %, and WACC as per your analysis.
- Update Automatically: The intrinsic value and NPV calculations refresh in real-time.
- Test Scenarios: Generate various projections and compare results immediately.
- Make Decisions: Leverage the valuation results to shape your investment strategy.
Why Select This Calculator for Guangdong Baolihua New Energy Stock Co., Ltd. (000690SZ)?
- Precise Data: Utilizes authentic financial figures from Baolihua for dependable valuation outcomes.
- Flexible Options: Modify essential variables such as growth rates, WACC, and tax rates to align with your financial forecasts.
- Efficiency Boost: Pre-configured calculations save you the hassle of starting from the ground up.
- Professional Quality: Tailored for the needs of investors, analysts, and financial consultants.
- Easy to Use: With its intuitive design and clear step-by-step guidance, it’s accessible for all users.
Who Should Use This Product?
- Individual Investors: Gain insights for making informed decisions on buying or selling shares of Guangdong Baolihua New Energy Stock Co., Ltd. (000690SZ).
- Financial Analysts: Enhance valuation methodologies with ready-to-apply financial models specific to the energy sector.
- Consultants: Provide clients with accurate and timely valuation analyses related to renewable energy companies.
- Business Owners: Learn about the valuation of large firms like Guangdong Baolihua to inform your strategic planning.
- Finance Students: Explore real-world data and applications of valuation techniques through the lens of Guangdong Baolihua (000690SZ).
What the Template Includes
- Historical Data: Contains Guangdong Baolihua’s previous financial performance and baseline projections.
- DCF and Levered DCF Models: Comprehensive templates to assess the intrinsic value of Guangdong Baolihua (000690SZ).
- WACC Sheet: Pre-constructed calculations for the Weighted Average Cost of Capital.
- Editable Inputs: Customize essential parameters such as growth rates, EBITDA margins, and CAPEX assumptions.
- Quarterly and Annual Statements: A thorough analysis of Guangdong Baolihua's financials.
- Interactive Dashboard: Dynamically visualize valuation outcomes and future projections.
Disclaimer
All information, articles, and product details provided on this website are for general informational and educational purposes only. We do not claim any ownership over, nor do we intend to infringe upon, any trademarks, copyrights, logos, brand names, or other intellectual property mentioned or depicted on this site. Such intellectual property remains the property of its respective owners, and any references here are made solely for identification or informational purposes, without implying any affiliation, endorsement, or partnership.
We make no representations or warranties, express or implied, regarding the accuracy, completeness, or suitability of any content or products presented. Nothing on this website should be construed as legal, tax, investment, financial, medical, or other professional advice. In addition, no part of this site—including articles or product references—constitutes a solicitation, recommendation, endorsement, advertisement, or offer to buy or sell any securities, franchises, or other financial instruments, particularly in jurisdictions where such activity would be unlawful.
All content is of a general nature and may not address the specific circumstances of any individual or entity. It is not a substitute for professional advice or services. Any actions you take based on the information provided here are strictly at your own risk. You accept full responsibility for any decisions or outcomes arising from your use of this website and agree to release us from any liability in connection with your use of, or reliance upon, the content or products found herein.