
|
Guoyuan Securities Company Limited (000728.SZ) DCF Valoración |
Completamente Editable: Adáptelo A Sus Necesidades En Excel O Sheets
Diseño Profesional: Plantillas Confiables Y Estándares De La Industria
Predeterminadas Para Un Uso Rápido Y Eficiente
Compatible con MAC / PC, completamente desbloqueado
No Se Necesita Experiencia; Fáciles De Seguir
Guoyuan Securities Company Limited (000728.SZ) Bundle
¡Explore la perspectiva financiera de Guoyuan Securities Company Limited (000728SZ) con nuestra calculadora DCF fácil de usar! Ingrese sus proyecciones para el crecimiento, los márgenes y los gastos para determinar el valor intrínseco de Guoyuan Securities Company Limited (000728SZ) y mejorar su enfoque de inversión.
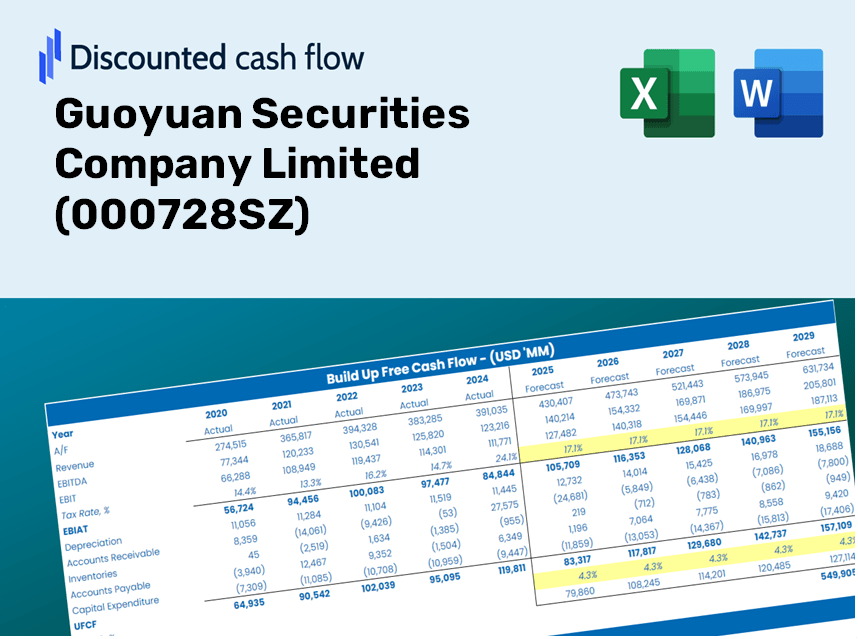
Discounted Cash Flow (DCF) - (USD MM)
| Year | AY1 2020 |
AY2 2021 |
AY3 2022 |
AY4 2023 |
AY5 2024 |
FY1 2025 |
FY2 2026 |
FY3 2027 |
FY4 2028 |
FY5 2029 |
|---|---|---|---|---|---|---|---|---|---|---|
| Revenue | 4,348.0 | 6,065.6 | 5,340.8 | 6,341.2 | 9,805.7 | 12,279.7 | 15,377.8 | 19,257.6 | 24,116.3 | 30,200.7 |
| Revenue Growth, % | 0 | 39.5 | -11.95 | 18.73 | 54.63 | 25.23 | 25.23 | 25.23 | 25.23 | 25.23 |
| EBITDA | 3,249.8 | 4,199.4 | 3,261.8 | 3,906.1 | 2,938.3 | 7,284.6 | 9,122.5 | 11,424.1 | 14,306.4 | 17,915.9 |
| EBITDA, % | 74.74 | 69.23 | 61.07 | 61.6 | 29.97 | 59.32 | 59.32 | 59.32 | 59.32 | 59.32 |
| Depreciation | 125.9 | 173.8 | 207.0 | 214.0 | 197.6 | 369.1 | 462.2 | 578.8 | 724.8 | 907.7 |
| Depreciation, % | 2.9 | 2.87 | 3.88 | 3.37 | 2.02 | 3.01 | 3.01 | 3.01 | 3.01 | 3.01 |
| EBIT | 3,123.9 | 4,025.7 | 3,054.8 | 3,692.1 | 2,740.7 | 6,915.6 | 8,660.3 | 10,845.3 | 13,581.6 | 17,008.2 |
| EBIT, % | 71.85 | 66.37 | 57.2 | 58.22 | 27.95 | 56.32 | 56.32 | 56.32 | 56.32 | 56.32 |
| Total Cash | 41,727.1 | 51,058.0 | 54,349.9 | 4,000.3 | 62,164.6 | 11,373.0 | 14,242.4 | 17,835.8 | 22,335.7 | 27,970.9 |
| Total Cash, percent | .0 | .0 | .0 | .0 | .0 | .0 | .0 | .0 | .0 | .0 |
| Account Receivables | 485.7 | 21,425.9 | 238.4 | 19,052.0 | 1,260.5 | 5,611.6 | 7,027.3 | 8,800.3 | 11,020.6 | 13,801.1 |
| Account Receivables, % | 11.17 | 353.24 | 4.46 | 300.45 | 12.85 | 45.7 | 45.7 | 45.7 | 45.7 | 45.7 |
| Inventories | .0 | 6.3 | 18.9 | 298.7 | .0 | 126.9 | 158.9 | 199.0 | 249.3 | 312.1 |
| Inventories, % | 0 | 0.10305 | 0.35386 | 4.71 | 0 | 1.03 | 1.03 | 1.03 | 1.03 | 1.03 |
| Accounts Payable | 1,131.7 | 2,081.9 | 2,968.4 | 974.4 | 994.0 | 3,473.5 | 4,349.8 | 5,447.3 | 6,821.6 | 8,542.7 |
| Accounts Payable, % | 26.03 | 34.32 | 55.58 | 15.37 | 10.14 | 28.29 | 28.29 | 28.29 | 28.29 | 28.29 |
| Capital Expenditure | -159.6 | -152.5 | -155.2 | -178.0 | -116.1 | -321.3 | -402.3 | -503.8 | -630.9 | -790.1 |
| Capital Expenditure, % | -3.67 | -2.51 | -2.91 | -2.81 | -1.18 | -2.62 | -2.62 | -2.62 | -2.62 | -2.62 |
| Tax Rate, % | 18.11 | 18.11 | 18.11 | 18.11 | 18.11 | 18.11 | 18.11 | 18.11 | 18.11 | 18.11 |
| EBITAT | 2,467.8 | 3,148.7 | 2,581.0 | 3,141.9 | 2,244.4 | 5,652.7 | 7,078.8 | 8,864.8 | 11,101.4 | 13,902.3 |
| Depreciation | ||||||||||
| Changes in Account Receivables | ||||||||||
| Changes in Inventories | ||||||||||
| Changes in Accounts Payable | ||||||||||
| Capital Expenditure | ||||||||||
| UFCF | 3,080.1 | -16,826.2 | 24,694.1 | -17,909.5 | 20,435.7 | 3,702.0 | 6,567.3 | 8,224.2 | 10,299.1 | 12,897.6 |
| WACC, % | 4.86 | 4.85 | 4.99 | 5 | 4.93 | 4.93 | 4.93 | 4.93 | 4.93 | 4.93 |
| PV UFCF | ||||||||||
| SUM PV UFCF | 35,249.9 | |||||||||
| Long Term Growth Rate, % | 2.00 | |||||||||
| Free cash flow (T + 1) | 13,156 | |||||||||
| Terminal Value | 449,460 | |||||||||
| Present Terminal Value | 353,391 | |||||||||
| Enterprise Value | 388,641 | |||||||||
| Net Debt | 84,896 | |||||||||
| Equity Value | 303,745 | |||||||||
| Diluted Shares Outstanding, MM | 4,401 | |||||||||
| Equity Value Per Share | 69.02 |
What You Will Receive
- Accurate Guoyuan Financials: Access to both historical and projected data for precise valuation.
- Customizable Inputs: Adjust WACC, tax rates, revenue growth, and capital expenditure figures as needed.
- Automated Calculations: Dynamic computation of intrinsic value and NPV.
- Scenario Testing: Analyze various scenarios to assess the future performance of Guoyuan Securities (000728SZ).
- User-Friendly Interface: Designed for professionals, yet simple enough for newcomers to navigate.
Key Features
- Pre-Loaded Data: Guoyuan Securities Company Limited’s historical financial statements and pre-filled forecasts.
- Fully Adjustable Inputs: Modify WACC, tax rates, revenue growth, and EBITDA margins to fit your analysis.
- Instant Results: View Guoyuan's intrinsic value recalculating in real time.
- Clear Visual Outputs: Interactive dashboard charts present valuation results and essential metrics.
- Built for Accuracy: A professional-grade tool tailored for analysts, investors, and finance professionals.
How It Works
- Step 1: Download the Excel file.
- Step 2: Examine Guoyuan Securities Company's pre-filled financial data and forecasts.
- Step 3: Adjust key inputs such as revenue growth, WACC, and tax rates (highlighted cells).
- Step 4: Observe the DCF model refresh in real-time as you modify your assumptions.
- Step 5: Evaluate the outputs and utilize the findings for your investment decisions.
Why Opt for This Calculator?
- All-in-One Solution: Combines DCF, WACC, and financial ratio analyses into a single tool.
- Flexible Inputs: Modify the yellow-highlighted fields to explore different scenarios.
- In-Depth Analysis: Automatically computes Guoyuan Securities Company's intrinsic value and Net Present Value.
- Preloaded Information: Historical and projected data provide a solid foundation for analysis.
- High-Caliber Features: Perfect for financial analysts, investors, and business consultants.
Who Should Utilize Guoyuan Securities Company Limited (000728SZ)?
- Investors: Assess the intrinsic value of Guoyuan Securities (000728SZ) before making investment choices.
- CFOs: Utilize a professional-grade DCF model for accurate financial reporting and analysis related to Guoyuan Securities (000728SZ).
- Consultants: Efficiently modify the template for client valuation reports pertaining to Guoyuan Securities (000728SZ).
- Entrepreneurs: Acquire knowledge on financial modeling practices employed by leading companies, including Guoyuan Securities (000728SZ).
- Educators: Implement it as an educational resource to illustrate valuation techniques relevant to Guoyuan Securities (000728SZ).
Overview of the Template
- Preloaded Guoyuan Securities Data: Historical and forecasted financial metrics, including revenue, EBIT, and capital expenditures.
- DCF and WACC Models: High-quality spreadsheets designed for calculating intrinsic value and Weighted Average Cost of Capital.
- Customizable Inputs: Yellow-highlighted fields for modifying revenue growth, tax rates, and discount rates.
- Financial Statements: Detailed annual and quarterly financials for thorough analysis.
- Key Ratios: Metrics for profitability, leverage, and efficiency to assess performance.
- Dashboard and Charts: Visual representations of valuation results and underlying assumptions.
Disclaimer
All information, articles, and product details provided on this website are for general informational and educational purposes only. We do not claim any ownership over, nor do we intend to infringe upon, any trademarks, copyrights, logos, brand names, or other intellectual property mentioned or depicted on this site. Such intellectual property remains the property of its respective owners, and any references here are made solely for identification or informational purposes, without implying any affiliation, endorsement, or partnership.
We make no representations or warranties, express or implied, regarding the accuracy, completeness, or suitability of any content or products presented. Nothing on this website should be construed as legal, tax, investment, financial, medical, or other professional advice. In addition, no part of this site—including articles or product references—constitutes a solicitation, recommendation, endorsement, advertisement, or offer to buy or sell any securities, franchises, or other financial instruments, particularly in jurisdictions where such activity would be unlawful.
All content is of a general nature and may not address the specific circumstances of any individual or entity. It is not a substitute for professional advice or services. Any actions you take based on the information provided here are strictly at your own risk. You accept full responsibility for any decisions or outcomes arising from your use of this website and agree to release us from any liability in connection with your use of, or reliance upon, the content or products found herein.