
|
CCCG Real Estate Corporation Limited (000736.SZ) DCF Valoración |
Completamente Editable: Adáptelo A Sus Necesidades En Excel O Sheets
Diseño Profesional: Plantillas Confiables Y Estándares De La Industria
Predeterminadas Para Un Uso Rápido Y Eficiente
Compatible con MAC / PC, completamente desbloqueado
No Se Necesita Experiencia; Fáciles De Seguir
CCCG Real Estate Corporation Limited (000736.SZ) Bundle
Diseñada para la precisión, nuestra calculadora DCF (000736SZ) le permite evaluar la valoración de CCCG Real Estate Corporation Limited utilizando datos financieros del mundo real y ofrece una flexibilidad completa para modificar todos los parámetros esenciales para mejorar las proyecciones.
What You Will Receive
- Genuine CCCG Financial Data: Pre-loaded with CCCG Real Estate Corporation Limited’s historical and projected figures for accurate assessment.
- Customizable Template: Easily adjust essential variables such as revenue growth, WACC, and EBITDA percentage.
- Instant Calculations: Watch the intrinsic value of CCCG update immediately as you make changes.
- Expert Valuation Tool: Created for investors, analysts, and consultants aiming for reliable DCF outcomes.
- User-Friendly Interface: Intuitive layout and straightforward guidance suitable for all skill levels.
Key Features
- Pre-Loaded Data: CCCG Real Estate Corporation Limited’s historical financial statements and pre-filled forecasts.
- Fully Adjustable Inputs: Modify WACC, tax rates, revenue growth, and EBITDA margins as needed.
- Instant Results: Watch the intrinsic value of CCCG Real Estate Corporation Limited recalibrate in real-time.
- Clear Visual Outputs: Interactive dashboard charts showcase valuation results and essential metrics.
- Built for Accuracy: A robust tool tailored for analysts, investors, and finance professionals.
How It Works
- Step 1: Download the preconstructed Excel template featuring CCCG Real Estate Corporation Limited’s (000736SZ) data.
- Step 2: Navigate through the filled sheets to familiarize yourself with the essential metrics.
- Step 3: Modify forecasts and assumptions in the editable yellow cells (WACC, growth, margins).
- Step 4: Instantly access updated results, including the intrinsic value of CCCG Real Estate Corporation Limited (000736SZ).
- Step 5: Make well-informed investment decisions or create reports based on the output data.
Why Choose the CCCG Real Estate Calculator?
- Precision: Leveraging real CCCG financial data for reliable outcomes.
- Adaptability: Built for users to easily adjust and test various inputs.
- Efficiency: Eliminate the complexities of constructing a real estate valuation model from the ground up.
- Enterprise-Level Quality: Created with the accuracy and usability expected at the CFO level.
- Intuitive Design: User-friendly interface suitable for both novices and experienced financial analysts.
Who Can Benefit from CCCG Real Estate Corporation Limited (000736SZ)?
- Real Estate Investors: Leverage a professional valuation tool to make informed investment choices.
- Market Analysts: Streamline your processes with a customizable DCF model designed for efficiency.
- Consultants: Easily modify the template for impactful client presentations and detailed reports.
- Real Estate Enthusiasts: Enhance your grasp of valuation methods through practical, real-life scenarios.
- Educators and Students: Utilize this resource as a hands-on learning aid in real estate and finance courses.
Contents of the Template
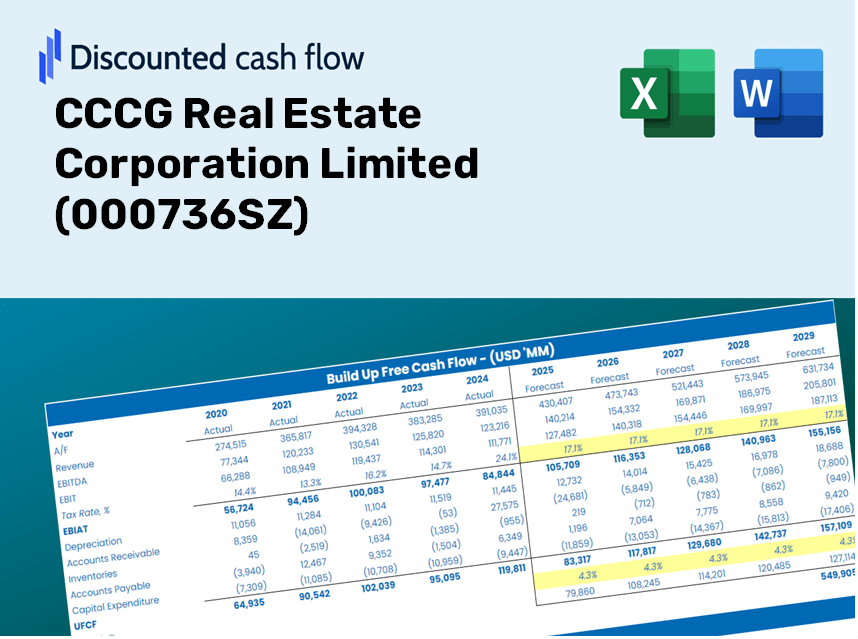
- Operating and Balance Sheet Data: Pre-populated historical data and forecasts for CCCG Real Estate Corporation Limited (000736SZ), covering metrics such as revenue, EBITDA, EBIT, and capital expenditures.
- WACC Calculation: A dedicated worksheet for calculating the Weighted Average Cost of Capital (WACC), featuring essential inputs like Beta, the risk-free rate, and share price.
- DCF Valuation (Unlevered and Levered): Customizable Discounted Cash Flow models that reveal intrinsic value with comprehensive calculations.
- Financial Statements: Pre-loaded annual and quarterly financial statements to facilitate in-depth analysis.
- Key Ratios: A summary of crucial ratios relating to profitability, leverage, and efficiency for CCCG Real Estate Corporation Limited (000736SZ).
- Dashboard and Charts: A visual overview of valuation outputs and underlying assumptions to simplify the analysis of results.
Disclaimer
All information, articles, and product details provided on this website are for general informational and educational purposes only. We do not claim any ownership over, nor do we intend to infringe upon, any trademarks, copyrights, logos, brand names, or other intellectual property mentioned or depicted on this site. Such intellectual property remains the property of its respective owners, and any references here are made solely for identification or informational purposes, without implying any affiliation, endorsement, or partnership.
We make no representations or warranties, express or implied, regarding the accuracy, completeness, or suitability of any content or products presented. Nothing on this website should be construed as legal, tax, investment, financial, medical, or other professional advice. In addition, no part of this site—including articles or product references—constitutes a solicitation, recommendation, endorsement, advertisement, or offer to buy or sell any securities, franchises, or other financial instruments, particularly in jurisdictions where such activity would be unlawful.
All content is of a general nature and may not address the specific circumstances of any individual or entity. It is not a substitute for professional advice or services. Any actions you take based on the information provided here are strictly at your own risk. You accept full responsibility for any decisions or outcomes arising from your use of this website and agree to release us from any liability in connection with your use of, or reliance upon, the content or products found herein.