
|
North Copper Co., Ltd. (000737.SZ) Valoración de DCF |
Completamente Editable: Adáptelo A Sus Necesidades En Excel O Sheets
Diseño Profesional: Plantillas Confiables Y Estándares De La Industria
Predeterminadas Para Un Uso Rápido Y Eficiente
Compatible con MAC / PC, completamente desbloqueado
No Se Necesita Experiencia; Fáciles De Seguir
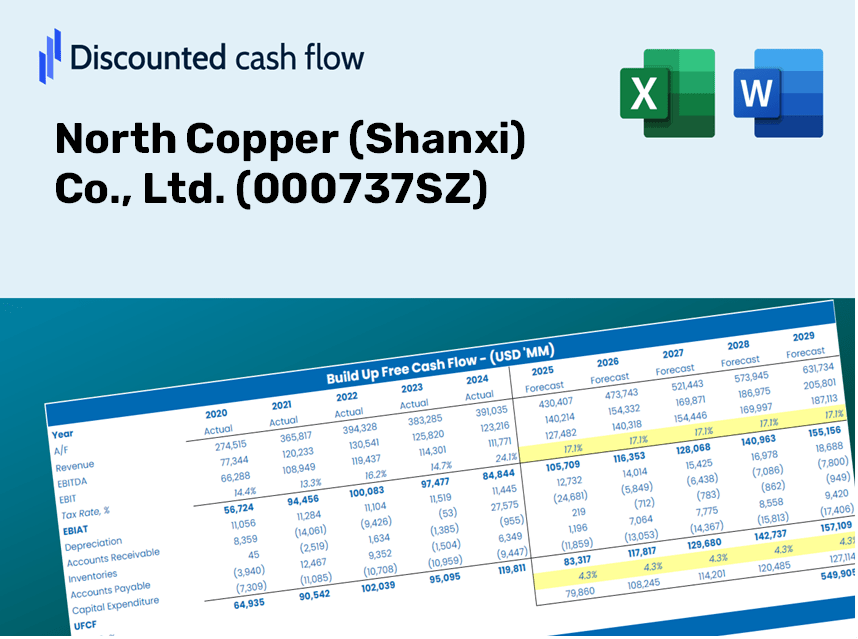
North Copper (Shanxi) Co., Ltd. (000737.SZ) Bundle
¡Descubra el verdadero valor de North Copper (Shanxi) Co., Ltd. (000737SZ) con nuestra calculadora DCF avanzada! Personalice los supuestos clave, explore varios escenarios y evalúe cómo los cambios afectan la valoración de North Copper (Shanxi) Co., Ltd. (000737SZ), todo dentro de una plantilla completa de Excel.
Discounted Cash Flow (DCF) - (USD MM)
| Year | AY1 2020 |
AY2 2021 |
AY3 2022 |
AY4 2023 |
AY5 2024 |
FY1 2025 |
FY2 2026 |
FY3 2027 |
FY4 2028 |
FY5 2029 |
|---|---|---|---|---|---|---|---|---|---|---|
| Revenue | 8,527.7 | 9,964.7 | 10,677.2 | 9,394.9 | 24,107.0 | 30,856.4 | 39,495.6 | 50,553.5 | 64,707.4 | 82,824.1 |
| Revenue Growth, % | 0 | 16.85 | 7.15 | -12.01 | 156.6 | 28 | 28 | 28 | 28 | 28 |
| EBITDA | 1,215.8 | 1,615.8 | 1,120.9 | 1,253.2 | 1,490.2 | 3,733.1 | 4,778.2 | 6,116.0 | 7,828.4 | 10,020.2 |
| EBITDA, % | 14.26 | 16.21 | 10.5 | 13.34 | 6.18 | 12.1 | 12.1 | 12.1 | 12.1 | 12.1 |
| Depreciation | 283.7 | 294.0 | 263.0 | 286.5 | 448.3 | 842.3 | 1,078.2 | 1,380.0 | 1,766.4 | 2,261.0 |
| Depreciation, % | 3.33 | 2.95 | 2.46 | 3.05 | 1.86 | 2.73 | 2.73 | 2.73 | 2.73 | 2.73 |
| EBIT | 932.1 | 1,321.8 | 857.9 | 966.7 | 1,041.9 | 2,890.7 | 3,700.1 | 4,736.0 | 6,062.0 | 7,759.2 |
| EBIT, % | 10.93 | 13.26 | 8.04 | 10.29 | 4.32 | 9.37 | 9.37 | 9.37 | 9.37 | 9.37 |
| Total Cash | 286.7 | 1,113.5 | 1,164.1 | 1,021.0 | 888.8 | 2,468.1 | 3,159.2 | 4,043.7 | 5,175.8 | 6,624.9 |
| Total Cash, percent | .0 | .0 | .0 | .0 | .0 | .0 | .0 | .0 | .0 | .0 |
| Account Receivables | 2,571.4 | 154.7 | 78.1 | 119.3 | 314.4 | 2,160.7 | 2,765.6 | 3,540.0 | 4,531.1 | 5,799.7 |
| Account Receivables, % | 30.15 | 1.55 | 0.73146 | 1.27 | 1.3 | 7 | 7 | 7 | 7 | 7 |
| Inventories | 115.8 | 2,693.2 | 1,674.9 | 4,787.7 | 6,430.2 | 7,510.8 | 9,613.7 | 12,305.3 | 15,750.6 | 20,160.4 |
| Inventories, % | 1.36 | 27.03 | 15.69 | 50.96 | 26.67 | 24.34 | 24.34 | 24.34 | 24.34 | 24.34 |
| Accounts Payable | 117.8 | 260.9 | 513.9 | 1,896.5 | 2,003.1 | 2,302.4 | 2,947.1 | 3,772.2 | 4,828.3 | 6,180.1 |
| Accounts Payable, % | 1.38 | 2.62 | 4.81 | 20.19 | 8.31 | 7.46 | 7.46 | 7.46 | 7.46 | 7.46 |
| Capital Expenditure | -13.7 | -232.2 | -599.7 | -1,627.4 | -1,008.0 | -1,827.3 | -2,339.0 | -2,993.8 | -3,832.0 | -4,904.9 |
| Capital Expenditure, % | -0.16025 | -2.33 | -5.62 | -17.32 | -4.18 | -5.92 | -5.92 | -5.92 | -5.92 | -5.92 |
| Tax Rate, % | 19.55 | 19.55 | 19.55 | 19.55 | 19.55 | 19.55 | 19.55 | 19.55 | 19.55 | 19.55 |
| EBITAT | 732.6 | 1,011.9 | 673.5 | 727.4 | 838.2 | 2,251.0 | 2,881.3 | 3,688.0 | 4,720.5 | 6,042.2 |
| Depreciation | ||||||||||
| Changes in Account Receivables | ||||||||||
| Changes in Inventories | ||||||||||
| Changes in Accounts Payable | ||||||||||
| Capital Expenditure | ||||||||||
| UFCF | -1,566.7 | 1,056.0 | 1,684.7 | -2,384.9 | -1,452.4 | -1,361.6 | -442.7 | -566.6 | -725.3 | -928.3 |
| WACC, % | 8.56 | 8.54 | 8.56 | 8.53 | 8.58 | 8.55 | 8.55 | 8.55 | 8.55 | 8.55 |
| PV UFCF | ||||||||||
| SUM PV UFCF | -3,211.1 | |||||||||
| Long Term Growth Rate, % | 2.00 | |||||||||
| Free cash flow (T + 1) | -947 | |||||||||
| Terminal Value | -14,446 | |||||||||
| Present Terminal Value | -9,583 | |||||||||
| Enterprise Value | -12,794 | |||||||||
| Net Debt | 6,254 | |||||||||
| Equity Value | -19,049 | |||||||||
| Diluted Shares Outstanding, MM | 1,771 | |||||||||
| Equity Value Per Share | -10.76 |
Benefits You Will Receive
- Pre-Built Financial Model: Utilize North Copper’s (000737SZ) actual data for accurate DCF valuation.
- Comprehensive Forecasting Control: Modify key metrics such as revenue growth, profit margins, WACC, and more.
- Real-Time Calculations: See immediate updates as you make adjustments to your inputs.
- Professional-Grade Template: A polished Excel file crafted for serious valuation analysis.
- Flexible and Reusable: Designed for adaptability, allowing for repeated application to various detailed forecasts.
Key Features
- Accurate Historical Data: Pre-loaded with North Copper (Shanxi) Co., Ltd. (000737SZ) financials and future estimates.
- Customizable Parameters: Tailor inputs such as revenue growth rates, profit margins, WACC, tax rates, and capital investments.
- Interactive Valuation Tool: Automatic recalculations of Net Present Value (NPV) and intrinsic value based on your parameters.
- Comprehensive Scenario Analysis: Develop various forecasting scenarios to examine different valuation possibilities.
- Intuitive Interface: Designed for ease of use, catering to both industry professionals and novices.
How It Functions
- Step 1: Download the Excel spreadsheet.
- Step 2: Examine the pre-filled data for North Copper (Shanxi) Co., Ltd. (000737SZ), including historical and projected figures.
- Step 3: Modify the key assumptions (highlighted in yellow) according to your analysis.
- Step 4: Observe the automatic updates for North Copper’s intrinsic value.
- Step 5: Utilize the results for making investment decisions or for reporting purposes.
Why Opt for North Copper's Calculator?
- All-in-One Solution: Combines DCF, WACC, and financial ratio analyses in a single platform.
- Flexible Inputs: Modify the yellow-highlighted fields to explore different scenarios.
- In-Depth Analysis: Automatically calculates the intrinsic value and Net Present Value for North Copper (000737SZ).
- Preloaded Information: Historical and projected data provide reliable starting points for analysis.
- High-Quality Standards: Perfect for financial analysts, investors, and business consultants alike.
Who Can Benefit from This Product?
- Investors: Gain precise insights into the fair value of North Copper (Shanxi) Co., Ltd. (000737SZ) for informed investment choices.
- CFOs: Utilize a top-tier DCF model for enhanced financial reporting and analysis.
- Consultants: Effortlessly customize the template for client valuation reports.
- Entrepreneurs: Learn from the financial modeling techniques employed by leading companies in the industry.
- Educators: Employ it as a practical tool to illustrate various valuation methodologies.
Contents of the Template
- Detailed DCF Model: Fully editable template featuring in-depth valuation calculations.
- Historical and Projected Data: Preloaded financial data for North Copper (Shanxi) Co., Ltd. (000737SZ) for thorough analysis.
- Adjustable Variables: Modify WACC, growth rates, and tax assumptions to explore different scenarios.
- Comprehensive Financial Statements: Annual and quarterly financial breakdowns for enhanced insights.
- Essential Ratios: Integrated analysis for profitability, efficiency, and leverage metrics.
- Visual Dashboard: Graphs and tables providing clear, actionable insights.
Disclaimer
All information, articles, and product details provided on this website are for general informational and educational purposes only. We do not claim any ownership over, nor do we intend to infringe upon, any trademarks, copyrights, logos, brand names, or other intellectual property mentioned or depicted on this site. Such intellectual property remains the property of its respective owners, and any references here are made solely for identification or informational purposes, without implying any affiliation, endorsement, or partnership.
We make no representations or warranties, express or implied, regarding the accuracy, completeness, or suitability of any content or products presented. Nothing on this website should be construed as legal, tax, investment, financial, medical, or other professional advice. In addition, no part of this site—including articles or product references—constitutes a solicitation, recommendation, endorsement, advertisement, or offer to buy or sell any securities, franchises, or other financial instruments, particularly in jurisdictions where such activity would be unlawful.
All content is of a general nature and may not address the specific circumstances of any individual or entity. It is not a substitute for professional advice or services. Any actions you take based on the information provided here are strictly at your own risk. You accept full responsibility for any decisions or outcomes arising from your use of this website and agree to release us from any liability in connection with your use of, or reliance upon, the content or products found herein.