
|
Sufa Technology Industry Co., Ltd. CNNC (000777.SZ) DCF Valoración |
Completamente Editable: Adáptelo A Sus Necesidades En Excel O Sheets
Diseño Profesional: Plantillas Confiables Y Estándares De La Industria
Predeterminadas Para Un Uso Rápido Y Eficiente
Compatible con MAC / PC, completamente desbloqueado
No Se Necesita Experiencia; Fáciles De Seguir
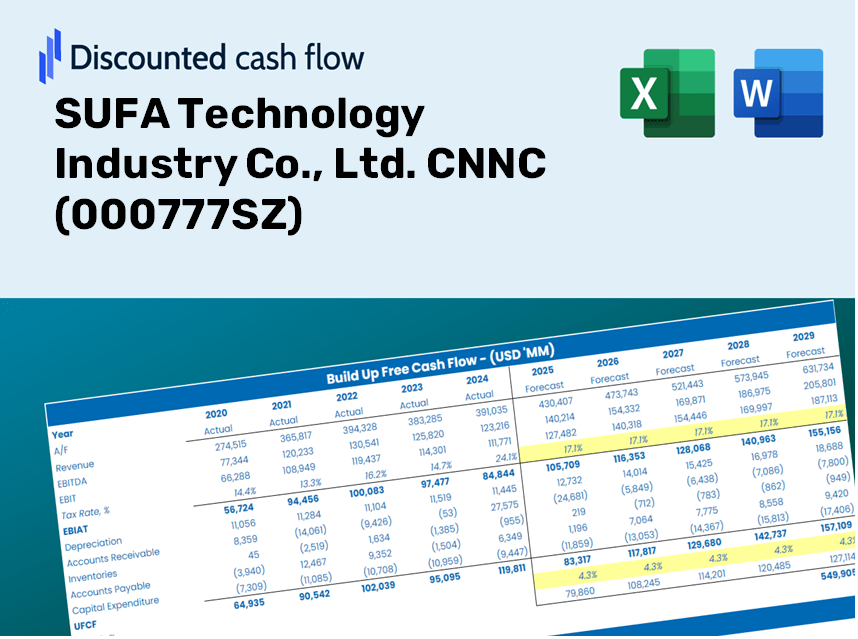
SUFA Technology Industry Co., Ltd. CNNC (000777.SZ) Bundle
¡Obtenga información sobre su SUFA Technology Industry Co., Ltd. (000777SZ) Análisis de valoración utilizando nuestra sofisticada calculadora DCF! Esta plantilla de Excel viene precargada con datos reales (000777SZ), lo que le permite ajustar los pronósticos y los supuestos para determinar con precisión el valor intrínseco de la tecnología Sufa.
Discounted Cash Flow (DCF) - (USD MM)
| Year | AY1 2020 |
AY2 2021 |
AY3 2022 |
AY4 2023 |
AY5 2024 |
FY1 2025 |
FY2 2026 |
FY3 2027 |
FY4 2028 |
FY5 2029 |
|---|---|---|---|---|---|---|---|---|---|---|
| Revenue | 1,166.9 | 1,557.5 | 1,500.1 | 1,809.8 | 1,843.4 | 2,084.5 | 2,357.0 | 2,665.2 | 3,013.6 | 3,407.7 |
| Revenue Growth, % | 0 | 33.48 | -3.69 | 20.65 | 1.86 | 13.07 | 13.07 | 13.07 | 13.07 | 13.07 |
| EBITDA | 144.7 | 98.8 | 215.7 | 264.2 | 100.3 | 221.6 | 250.6 | 283.4 | 320.4 | 362.3 |
| EBITDA, % | 12.4 | 6.34 | 14.38 | 14.6 | 5.44 | 10.63 | 10.63 | 10.63 | 10.63 | 10.63 |
| Depreciation | 32.3 | 38.6 | 37.8 | 54.9 | 28.2 | 51.4 | 58.1 | 65.7 | 74.3 | 84.0 |
| Depreciation, % | 2.77 | 2.48 | 2.52 | 3.03 | 1.53 | 2.47 | 2.47 | 2.47 | 2.47 | 2.47 |
| EBIT | 112.3 | 60.2 | 177.9 | 209.4 | 72.1 | 170.2 | 192.5 | 217.7 | 246.1 | 278.3 |
| EBIT, % | 9.63 | 3.86 | 11.86 | 11.57 | 3.91 | 8.17 | 8.17 | 8.17 | 8.17 | 8.17 |
| Total Cash | 134.1 | 310.8 | 312.3 | 247.0 | 417.2 | 369.1 | 417.4 | 472.0 | 533.7 | 603.5 |
| Total Cash, percent | .0 | .0 | .0 | .0 | .0 | .0 | .0 | .0 | .0 | .0 |
| Account Receivables | 863.6 | 1,037.0 | 981.2 | 1,214.9 | 1,404.3 | 1,456.2 | 1,646.6 | 1,861.9 | 2,105.4 | 2,380.6 |
| Account Receivables, % | 74.01 | 66.58 | 65.41 | 67.13 | 76.18 | 69.86 | 69.86 | 69.86 | 69.86 | 69.86 |
| Inventories | 426.7 | 476.3 | 495.2 | 523.5 | 523.2 | 656.4 | 742.3 | 839.3 | 949.1 | 1,073.1 |
| Inventories, % | 36.57 | 30.58 | 33.01 | 28.92 | 28.38 | 31.49 | 31.49 | 31.49 | 31.49 | 31.49 |
| Accounts Payable | 502.6 | 609.1 | 707.4 | 827.0 | 866.7 | 925.7 | 1,046.7 | 1,183.6 | 1,338.3 | 1,513.3 |
| Accounts Payable, % | 43.07 | 39.1 | 47.16 | 45.7 | 47.02 | 44.41 | 44.41 | 44.41 | 44.41 | 44.41 |
| Capital Expenditure | -21.9 | -15.1 | -20.6 | -21.9 | -29.5 | -29.3 | -33.1 | -37.5 | -42.4 | -47.9 |
| Capital Expenditure, % | -1.88 | -0.96758 | -1.37 | -1.21 | -1.6 | -1.41 | -1.41 | -1.41 | -1.41 | -1.41 |
| Tax Rate, % | 2.43 | 2.43 | 2.43 | 2.43 | 2.43 | 2.43 | 2.43 | 2.43 | 2.43 | 2.43 |
| EBITAT | 111.9 | 60.3 | 176.7 | 210.2 | 70.3 | 169.0 | 191.2 | 216.1 | 244.4 | 276.4 |
| Depreciation | ||||||||||
| Changes in Account Receivables | ||||||||||
| Changes in Inventories | ||||||||||
| Changes in Accounts Payable | ||||||||||
| Capital Expenditure | ||||||||||
| UFCF | -665.3 | -32.7 | 329.1 | 100.8 | -80.4 | 64.9 | 61.0 | 68.9 | 77.9 | 88.1 |
| WACC, % | 6.01 | 6.01 | 6.01 | 6.01 | 6.01 | 6.01 | 6.01 | 6.01 | 6.01 | 6.01 |
| PV UFCF | ||||||||||
| SUM PV UFCF | 300.9 | |||||||||
| Long Term Growth Rate, % | 4.00 | |||||||||
| Free cash flow (T + 1) | 92 | |||||||||
| Terminal Value | 4,559 | |||||||||
| Present Terminal Value | 3,406 | |||||||||
| Enterprise Value | 3,706 | |||||||||
| Net Debt | -236 | |||||||||
| Equity Value | 3,942 | |||||||||
| Diluted Shares Outstanding, MM | 382 | |||||||||
| Equity Value Per Share | 10.31 |
Benefits You Will Receive
- Customizable Excel Template: An Excel-based DCF Calculator tailored for SUFA Technology Industry Co., Ltd. with pre-filled financial data for [Symbol].
- Accurate Data Insights: Access to historical figures and future projections (highlighted in the yellow cells).
- Adaptable Forecasting: Modify forecast parameters such as revenue growth, EBITDA %, and WACC as needed.
- Instant Calculations: Quickly assess how your inputs affect the valuation of SUFA Technology Industry Co., Ltd.
- Professional-Grade Tool: Designed for investors, CFOs, consultants, and financial analysts in mind.
- Intuitive Interface: Organized for smooth navigation and ease of use, complete with step-by-step guidance.
Key Features
- Comprehensive DCF Calculator: Offers detailed unlevered and levered DCF valuation models tailored for SUFA Technology Industry Co., Ltd. (000777SZ).
- WACC Tool: Features a pre-built Weighted Average Cost of Capital sheet with flexible input options.
- Customizable Forecast Parameters: Adjust growth rates, capital expenditures, and discount rates to fit your analysis needs.
- Integrated Financial Ratios: Evaluate profitability, leverage, and efficiency ratios specific to SUFA Technology Industry Co., Ltd. (000777SZ).
- Intuitive Dashboard and Visualizations: Present key valuation metrics through visual outputs for straightforward analysis.
How It Functions
- 1. Access the Template: Download and open the Excel file containing preloaded data specific to SUFA Technology Industry Co., Ltd. (000777SZ).
- 2. Modify Assumptions: Adjust crucial inputs such as growth rates, WACC, and capital expenditures as per your analysis.
- 3. View Immediate Results: The DCF model will automatically calculate the intrinsic value and NPV in real-time.
- 4. Explore Different Scenarios: Analyze various forecasts to evaluate a range of potential valuation outcomes.
- 5. Present with Assurance: Utilize professional valuation insights to confidently support your investment decisions.
Why Opt for SUFA Technology Industry Co., Ltd. (000777SZ) Calculator?
- Efficiency Boost: No need to build a DCF model from the ground up – it’s ready for immediate use.
- Enhanced Precision: Dependable financial data and formulas minimize valuation errors.
- Completely Adaptable: Adjust the model to align with your own assumptions and forecasts.
- User-Friendly: Intuitive charts and outputs simplify result analysis.
- Endorsed by Professionals: Crafted for experts who prioritize accuracy and functionality.
Who Should Use This Product?
- Investors: Accurately assess the fair value of SUFA Technology Industry Co., Ltd. (000777SZ) prior to making investment decisions.
- CFOs: Utilize a professional-grade DCF model for comprehensive financial reporting and analysis of SUFA Technology.
- Consultants: Adapt the template swiftly for client valuation reports regarding SUFA Technology Industry Co., Ltd.
- Entrepreneurs: Acquire valuable insights into financial modeling practices employed by leading technology firms.
- Educators: Employ it as a teaching resource to illustrate various valuation methodologies in the technology sector.
Contents of the Template
- Operating and Balance Sheet Data: Pre-filled historical data and forecasts for SUFA Technology Industry Co., Ltd. (000777SZ), including revenue, EBITDA, EBIT, and capital expenditures.
- WACC Calculation: A dedicated sheet for the Weighted Average Cost of Capital (WACC), featuring parameters such as Beta, risk-free rate, and share price.
- DCF Valuation (Unlevered and Levered): Editable Discounted Cash Flow models displaying intrinsic value along with detailed calculations.
- Financial Statements: Pre-loaded annual and quarterly financial statements for in-depth analysis.
- Key Ratios: Includes profitability, leverage, and efficiency ratios specific to SUFA Technology Industry Co., Ltd. (000777SZ).
- Dashboard and Charts: A visual summary of valuation outputs and assumptions to facilitate easy analysis of results.
Disclaimer
All information, articles, and product details provided on this website are for general informational and educational purposes only. We do not claim any ownership over, nor do we intend to infringe upon, any trademarks, copyrights, logos, brand names, or other intellectual property mentioned or depicted on this site. Such intellectual property remains the property of its respective owners, and any references here are made solely for identification or informational purposes, without implying any affiliation, endorsement, or partnership.
We make no representations or warranties, express or implied, regarding the accuracy, completeness, or suitability of any content or products presented. Nothing on this website should be construed as legal, tax, investment, financial, medical, or other professional advice. In addition, no part of this site—including articles or product references—constitutes a solicitation, recommendation, endorsement, advertisement, or offer to buy or sell any securities, franchises, or other financial instruments, particularly in jurisdictions where such activity would be unlawful.
All content is of a general nature and may not address the specific circumstances of any individual or entity. It is not a substitute for professional advice or services. Any actions you take based on the information provided here are strictly at your own risk. You accept full responsibility for any decisions or outcomes arising from your use of this website and agree to release us from any liability in connection with your use of, or reliance upon, the content or products found herein.