
|
Hangjin Technology Co., Ltd. (000818.sz) Valoración de DCF |
Completamente Editable: Adáptelo A Sus Necesidades En Excel O Sheets
Diseño Profesional: Plantillas Confiables Y Estándares De La Industria
Predeterminadas Para Un Uso Rápido Y Eficiente
Compatible con MAC / PC, completamente desbloqueado
No Se Necesita Experiencia; Fáciles De Seguir
Hangjin Technology Co., Ltd. (000818.SZ) Bundle
¡Agilice su análisis y mejore la precisión con nuestra calculadora DCF (000818SZ)! Utilizando datos reales de Hangjin Technology Co., Ltd. y suposiciones personalizables, esta herramienta le permite pronosticar, analizar y valorar la tecnología Hangjin como un inversor experimentado.
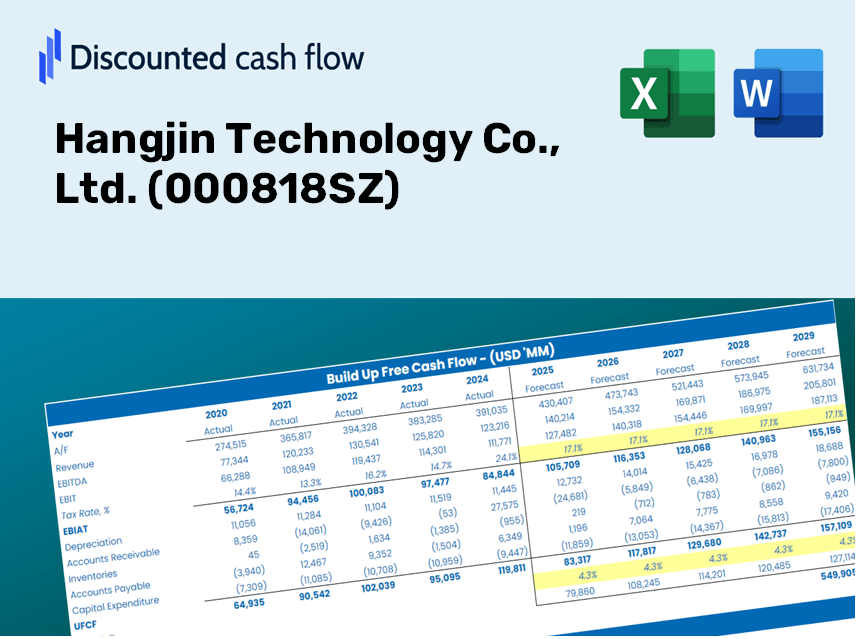
Discounted Cash Flow (DCF) - (USD MM)
| Year | AY1 2020 |
AY2 2021 |
AY3 2022 |
AY4 2023 |
AY5 2024 |
FY1 2025 |
FY2 2026 |
FY3 2027 |
FY4 2028 |
FY5 2029 |
|---|---|---|---|---|---|---|---|---|---|---|
| Revenue | 3,536.5 | 4,858.6 | 4,291.9 | 3,668.4 | 4,171.7 | 4,431.6 | 4,707.6 | 5,000.8 | 5,312.2 | 5,643.1 |
| Revenue Growth, % | 0 | 37.38 | -11.66 | -14.53 | 13.72 | 6.23 | 6.23 | 6.23 | 6.23 | 6.23 |
| EBITDA | 545.8 | 1,056.8 | 423.8 | 379.7 | 192.9 | 549.8 | 584.0 | 620.4 | 659.0 | 700.1 |
| EBITDA, % | 15.43 | 21.75 | 9.87 | 10.35 | 4.62 | 12.41 | 12.41 | 12.41 | 12.41 | 12.41 |
| Depreciation | 171.2 | 179.0 | 183.9 | 190.2 | 271.2 | 217.1 | 230.6 | 245.0 | 260.2 | 276.5 |
| Depreciation, % | 4.84 | 3.68 | 4.28 | 5.18 | 6.5 | 4.9 | 4.9 | 4.9 | 4.9 | 4.9 |
| EBIT | 374.5 | 877.8 | 239.9 | 189.5 | -78.3 | 332.7 | 353.4 | 375.4 | 398.8 | 423.6 |
| EBIT, % | 10.59 | 18.07 | 5.59 | 5.16 | -1.88 | 7.51 | 7.51 | 7.51 | 7.51 | 7.51 |
| Total Cash | 388.3 | 535.9 | 430.2 | 715.6 | 1,341.9 | 741.9 | 788.1 | 837.2 | 889.3 | 944.7 |
| Total Cash, percent | .0 | .0 | .0 | .0 | .0 | .0 | .0 | .0 | .0 | .0 |
| Account Receivables | 893.7 | 1,069.6 | 1,020.4 | 1,133.4 | 1,063.9 | 1,129.7 | 1,200.0 | 1,274.8 | 1,354.2 | 1,438.5 |
| Account Receivables, % | 25.27 | 22.01 | 23.78 | 30.9 | 25.5 | 25.49 | 25.49 | 25.49 | 25.49 | 25.49 |
| Inventories | 435.6 | 533.8 | 560.4 | 750.4 | 787.0 | 670.8 | 712.6 | 756.9 | 804.1 | 854.2 |
| Inventories, % | 12.32 | 10.99 | 13.06 | 20.45 | 18.86 | 15.14 | 15.14 | 15.14 | 15.14 | 15.14 |
| Accounts Payable | 496.3 | 286.1 | 401.9 | 263.3 | 513.2 | 432.2 | 459.2 | 487.8 | 518.1 | 550.4 |
| Accounts Payable, % | 14.03 | 5.89 | 9.36 | 7.18 | 12.3 | 9.75 | 9.75 | 9.75 | 9.75 | 9.75 |
| Capital Expenditure | -164.0 | -38.2 | -64.9 | -261.4 | -1,929.1 | -534.5 | -567.8 | -603.2 | -640.7 | -680.6 |
| Capital Expenditure, % | -4.64 | -0.78715 | -1.51 | -7.13 | -46.24 | -12.06 | -12.06 | -12.06 | -12.06 | -12.06 |
| Tax Rate, % | -2.68 | -2.68 | -2.68 | -2.68 | -2.68 | -2.68 | -2.68 | -2.68 | -2.68 | -2.68 |
| EBITAT | 335.8 | 783.9 | 240.5 | 159.9 | -80.4 | 308.3 | 327.5 | 347.9 | 369.6 | 392.6 |
| Depreciation | ||||||||||
| Changes in Account Receivables | ||||||||||
| Changes in Inventories | ||||||||||
| Changes in Accounts Payable | ||||||||||
| Capital Expenditure | ||||||||||
| UFCF | -490.0 | 440.4 | 497.8 | -352.9 | -1,455.5 | -39.7 | -94.9 | -100.8 | -107.1 | -113.8 |
| WACC, % | 4.82 | 4.82 | 4.9 | 4.78 | 4.9 | 4.84 | 4.84 | 4.84 | 4.84 | 4.84 |
| PV UFCF | ||||||||||
| SUM PV UFCF | -390.1 | |||||||||
| Long Term Growth Rate, % | 4.00 | |||||||||
| Free cash flow (T + 1) | -118 | |||||||||
| Terminal Value | -14,031 | |||||||||
| Present Terminal Value | -11,076 | |||||||||
| Enterprise Value | -11,466 | |||||||||
| Net Debt | 968 | |||||||||
| Equity Value | -12,434 | |||||||||
| Diluted Shares Outstanding, MM | 671 | |||||||||
| Equity Value Per Share | -18.54 |
Benefits You Will Receive
- Customizable Excel Template: A fully adaptable Excel-based DCF Calculator featuring pre-filled financial data for Hangjin Technology Co., Ltd. (000818SZ).
- Accurate Data Insights: Access to historical performance metrics and forward-looking projections (highlighted in the yellow cells).
- Assumption Flexibility: Modify key forecast parameters such as revenue growth, EBITDA %, and WACC.
- Instant Calculations: Quickly view how your adjustments affect the valuation of Hangjin Technology Co., Ltd. (000818SZ).
- Designed for Professionals: Crafted for investors, CFOs, consultants, and financial analysts.
- User-Centric Layout: Organized for clarity and ease of navigation, complete with step-by-step guidance.
Key Features
- Pre-Loaded Data: Hangjin Technology Co., Ltd.'s historical financial statements and pre-filled forecasts.
- Fully Adjustable Inputs: Modify WACC, tax rates, revenue growth, and EBITDA margins as needed.
- Instant Results: Observe Hangjin Technology's intrinsic value recalculating in real time.
- Clear Visual Outputs: Dashboard charts present valuation results and essential metrics.
- Built for Accuracy: A professional tool designed for analysts, investors, and finance specialists.
How It Works
- Step 1: Download the prebuilt Excel template containing Hangjin Technology Co., Ltd.'s (000818SZ) data.
- Step 2: Navigate through the pre-filled sheets to familiarize yourself with the key metrics.
- Step 3: Modify the forecasts and assumptions in the editable yellow cells (WACC, growth, margins).
- Step 4: Instantly see the recalculated results, including the intrinsic value of Hangjin Technology Co., Ltd. (000818SZ).
- Step 5: Utilize the outputs to make informed investment decisions or generate detailed reports.
Why Choose This Calculator for Hangjin Technology Co., Ltd. (000818SZ)?
- Designed for Experts: A sophisticated tool favored by analysts, CFOs, and industry consultants.
- Accurate Financials: Hangjin Technology’s historical and projected financial data preloaded for precise calculations.
- Flexible Scenario Analysis: Effortlessly test various forecasts and assumptions.
- Comprehensive Outputs: Automatically computes intrinsic value, NPV, and other essential metrics.
- User-Friendly: Clear, step-by-step guidance makes the process straightforward.
Who Can Benefit from Hangjin Technology Co., Ltd. (000818SZ)?
- Finance Students: Master valuation techniques and apply them with the latest market data.
- Academics: Integrate advanced financial models into your research and teaching materials.
- Investors: Validate your investment strategies and assess valuation scenarios for Hangjin Technology Co., Ltd. (000818SZ).
- Analysts: Enhance your analysis process using a ready-to-use, customizable DCF model.
- Small Business Owners: Understand the analytical methods used for large public companies like Hangjin Technology Co., Ltd. (000818SZ).
What the Template Contains
- Pre-Filled DCF Model: Hangjin Technology’s financial data pre-loaded for immediate application.
- WACC Calculator: Comprehensive calculations for Weighted Average Cost of Capital.
- Financial Ratios: Assess Hangjin Technology’s profitability, leverage, and operational efficiency.
- Editable Inputs: Modify assumptions such as growth rates, profit margins, and CAPEX to align with your scenarios.
- Financial Statements: Access to annual and quarterly reports for in-depth analysis.
- Interactive Dashboard: Effortlessly visualize key valuation metrics and outcomes.
Disclaimer
All information, articles, and product details provided on this website are for general informational and educational purposes only. We do not claim any ownership over, nor do we intend to infringe upon, any trademarks, copyrights, logos, brand names, or other intellectual property mentioned or depicted on this site. Such intellectual property remains the property of its respective owners, and any references here are made solely for identification or informational purposes, without implying any affiliation, endorsement, or partnership.
We make no representations or warranties, express or implied, regarding the accuracy, completeness, or suitability of any content or products presented. Nothing on this website should be construed as legal, tax, investment, financial, medical, or other professional advice. In addition, no part of this site—including articles or product references—constitutes a solicitation, recommendation, endorsement, advertisement, or offer to buy or sell any securities, franchises, or other financial instruments, particularly in jurisdictions where such activity would be unlawful.
All content is of a general nature and may not address the specific circumstances of any individual or entity. It is not a substitute for professional advice or services. Any actions you take based on the information provided here are strictly at your own risk. You accept full responsibility for any decisions or outcomes arising from your use of this website and agree to release us from any liability in connection with your use of, or reliance upon, the content or products found herein.