
|
Beijing Hualian Department Store Co., Ltd (000882.sz) Valoración de DCF |
Completamente Editable: Adáptelo A Sus Necesidades En Excel O Sheets
Diseño Profesional: Plantillas Confiables Y Estándares De La Industria
Predeterminadas Para Un Uso Rápido Y Eficiente
Compatible con MAC / PC, completamente desbloqueado
No Se Necesita Experiencia; Fáciles De Seguir
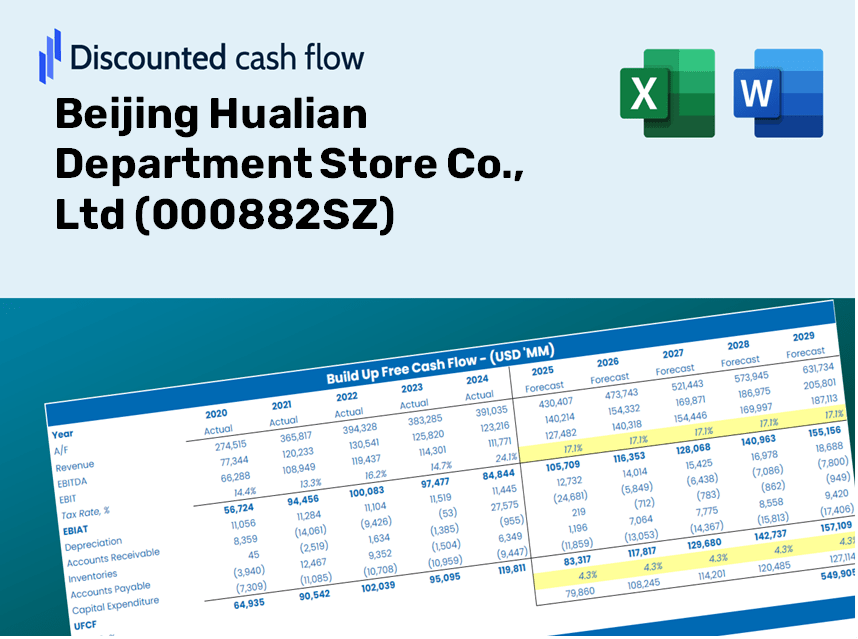
Beijing Hualian Department Store Co., Ltd (000882.SZ) Bundle
¡Explore las perspectivas financieras de Beijing Hualian Department Store Co., Ltd (000882SZ) con nuestra calculadora DCF fácil de usar! Ingrese sus proyecciones para el crecimiento, los márgenes y los costos para determinar el valor intrínseco de Beijing Hualian Department Store Co., Ltd (000882SZ) y refine su estrategia de inversión.
Discounted Cash Flow (DCF) - (USD MM)
| Year | AY1 2020 |
AY2 2021 |
AY3 2022 |
AY4 2023 |
AY5 2024 |
FY1 2025 |
FY2 2026 |
FY3 2027 |
FY4 2028 |
FY5 2029 |
|---|---|---|---|---|---|---|---|---|---|---|
| Revenue | 889.8 | 1,218.1 | 1,120.4 | 1,071.4 | 1,397.8 | 1,589.8 | 1,808.2 | 2,056.7 | 2,339.3 | 2,660.7 |
| Revenue Growth, % | 0 | 36.89 | -8.02 | -4.37 | 30.46 | 13.74 | 13.74 | 13.74 | 13.74 | 13.74 |
| EBITDA | 344.6 | 415.8 | 399.5 | 577.5 | 714.8 | 679.1 | 772.4 | 878.5 | 999.2 | 1,136.5 |
| EBITDA, % | 38.73 | 34.14 | 35.66 | 53.9 | 51.14 | 42.71 | 42.71 | 42.71 | 42.71 | 42.71 |
| Depreciation | 198.9 | 394.6 | 378.5 | 334.4 | 387.3 | 468.8 | 533.3 | 606.5 | 689.9 | 784.6 |
| Depreciation, % | 22.35 | 32.39 | 33.78 | 31.21 | 27.71 | 29.49 | 29.49 | 29.49 | 29.49 | 29.49 |
| EBIT | 145.7 | 21.2 | 21.0 | 243.1 | 327.6 | 210.2 | 239.1 | 272.0 | 309.3 | 351.8 |
| EBIT, % | 16.38 | 1.74 | 1.87 | 22.68 | 23.43 | 13.22 | 13.22 | 13.22 | 13.22 | 13.22 |
| Total Cash | 1,552.2 | 1,827.2 | 1,817.5 | 1,593.6 | 1,872.2 | 1,589.8 | 1,808.2 | 2,056.7 | 2,339.3 | 2,660.7 |
| Total Cash, percent | .0 | .0 | .0 | .0 | .0 | .0 | .0 | .0 | .0 | .0 |
| Account Receivables | 79.8 | 100.2 | 127.0 | 49.5 | 116.8 | 132.0 | 150.1 | 170.7 | 194.2 | 220.9 |
| Account Receivables, % | 8.97 | 8.22 | 11.33 | 4.62 | 8.36 | 8.3 | 8.3 | 8.3 | 8.3 | 8.3 |
| Inventories | 780.5 | 558.6 | 591.6 | 629.9 | 630.6 | 923.0 | 1,049.8 | 1,194.0 | 1,358.1 | 1,544.7 |
| Inventories, % | 87.71 | 45.86 | 52.81 | 58.79 | 45.11 | 58.06 | 58.06 | 58.06 | 58.06 | 58.06 |
| Accounts Payable | 296.2 | 469.1 | 340.9 | 301.7 | 316.2 | 486.5 | 553.4 | 629.4 | 715.9 | 814.2 |
| Accounts Payable, % | 33.29 | 38.51 | 30.43 | 28.16 | 22.62 | 30.6 | 30.6 | 30.6 | 30.6 | 30.6 |
| Capital Expenditure | -256.8 | -70.7 | -253.8 | -118.5 | -275.7 | -280.1 | -318.6 | -362.4 | -412.2 | -468.8 |
| Capital Expenditure, % | -28.86 | -5.81 | -22.66 | -11.06 | -19.72 | -17.62 | -17.62 | -17.62 | -17.62 | -17.62 |
| Tax Rate, % | 65.14 | 65.14 | 65.14 | 65.14 | 65.14 | 65.14 | 65.14 | 65.14 | 65.14 | 65.14 |
| EBITAT | 75.1 | 22.2 | 20.9 | 211.0 | 114.2 | 156.7 | 178.2 | 202.7 | 230.5 | 262.2 |
| Depreciation | ||||||||||
| Changes in Account Receivables | ||||||||||
| Changes in Inventories | ||||||||||
| Changes in Accounts Payable | ||||||||||
| Capital Expenditure | ||||||||||
| UFCF | -547.0 | 720.6 | -42.4 | 426.9 | 172.2 | 208.2 | 314.7 | 358.0 | 407.1 | 463.1 |
| WACC, % | 4.88 | 6.2 | 6.19 | 5.84 | 4.43 | 5.51 | 5.51 | 5.51 | 5.51 | 5.51 |
| PV UFCF | ||||||||||
| SUM PV UFCF | 1,467.5 | |||||||||
| Long Term Growth Rate, % | 4.00 | |||||||||
| Free cash flow (T + 1) | 482 | |||||||||
| Terminal Value | 31,916 | |||||||||
| Present Terminal Value | 24,409 | |||||||||
| Enterprise Value | 25,877 | |||||||||
| Net Debt | 2,824 | |||||||||
| Equity Value | 23,053 | |||||||||
| Diluted Shares Outstanding, MM | 2,747 | |||||||||
| Equity Value Per Share | 8.39 |
What You Will Receive
- Adjustable Forecast Inputs: Easily modify key assumptions (growth %, margins, WACC) to explore various scenarios.
- Industry Data: Beijing Hualian Department Store Co., Ltd’s (000882SZ) financial information pre-loaded to enhance your analysis.
- Automated DCF Outputs: The template computes Net Present Value (NPV) and intrinsic value effortlessly.
- Tailored and Professional: A sleek Excel model that aligns with your valuation requirements.
- Designed for Analysts and Investors: Perfect for evaluating projections, validating strategies, and saving valuable time.
Key Features
- Comprehensive Historical Data: Pre-loaded with Beijing Hualian Department Store Co., Ltd's (000882SZ) past financial performance and future forecasts.
- Customizable Parameters: Modify inputs such as revenue growth, profit margins, WACC, tax rates, and capital expenditures to suit your analysis.
- Interactive Valuation Model: Automatically recalculates Net Present Value (NPV) and intrinsic value in response to your adjustments.
- Scenario Analysis: Develop various forecasting scenarios to explore differing valuation results.
- User-Friendly Interface: Intuitive and organized layout, catering to both experienced professionals and newcomers.
How It Functions
- Download the Template: Gain immediate access to the Excel-based DCF Calculator for Beijing Hualian Department Store Co., Ltd (000882SZ).
- Enter Your Assumptions: Modify the yellow-highlighted cells to set growth rates, WACC, margins, and other parameters.
- Real-Time Calculations: The model will update the intrinsic value of Beijing Hualian automatically.
- Evaluate Scenarios: Experiment with various assumptions to analyze potential shifts in valuation.
- Analyze and Make Decisions: Utilize the outcomes to inform your investment or financial strategies.
Why Choose This Calculator for Beijing Hualian Department Store Co., Ltd (000882SZ)?
- User-Friendly Interface: Perfectly suited for both newcomers and seasoned analysts.
- Customizable Parameters: Effortlessly adjust inputs to align with your financial assessments.
- Real-Time Updates: Instantly view alterations to the valuation of Beijing Hualian as you modify inputs.
- Preloaded Financial Data: Comes equipped with actual financial figures for swift evaluations.
- Widely Endorsed: Preferred by investors and analysts for making well-informed choices.
Who Can Benefit from This Product?
- Individual Investors: Make well-informed decisions regarding the purchase or sale of Beijing Hualian Department Store Co., Ltd (000882SZ) shares.
- Financial Analysts: Enhance valuation processes with accessible financial models tailored for Beijing Hualian Department Store Co., Ltd (000882SZ).
- Consultants: Provide clients with accurate and timely valuation insights related to Beijing Hualian Department Store Co., Ltd (000882SZ).
- Business Owners: Gain an understanding of how major corporations like Beijing Hualian Department Store Co., Ltd (000882SZ) are valued to inform your own business strategies.
- Finance Students: Acquire practical knowledge of valuation methods utilizing real-world data and situations specific to Beijing Hualian Department Store Co., Ltd (000882SZ).
Overview of Template Components
- Pre-Filled Data: Contains Beijing Hualian Department Store Co., Ltd's historical financial data and forecasts.
- Discounted Cash Flow Model: An editable DCF valuation model featuring automatic calculations.
- Weighted Average Cost of Capital (WACC): A dedicated worksheet for WACC computation based on user-defined inputs.
- Key Financial Ratios: Evaluate Beijing Hualian's profitability, operational efficiency, and financial leverage.
- Customizable Inputs: Easily modify revenue growth rates, profit margins, and tax percentages.
- User-Friendly Dashboard: Visual representations and tables summarizing essential valuation metrics.
Disclaimer
All information, articles, and product details provided on this website are for general informational and educational purposes only. We do not claim any ownership over, nor do we intend to infringe upon, any trademarks, copyrights, logos, brand names, or other intellectual property mentioned or depicted on this site. Such intellectual property remains the property of its respective owners, and any references here are made solely for identification or informational purposes, without implying any affiliation, endorsement, or partnership.
We make no representations or warranties, express or implied, regarding the accuracy, completeness, or suitability of any content or products presented. Nothing on this website should be construed as legal, tax, investment, financial, medical, or other professional advice. In addition, no part of this site—including articles or product references—constitutes a solicitation, recommendation, endorsement, advertisement, or offer to buy or sell any securities, franchises, or other financial instruments, particularly in jurisdictions where such activity would be unlawful.
All content is of a general nature and may not address the specific circumstances of any individual or entity. It is not a substitute for professional advice or services. Any actions you take based on the information provided here are strictly at your own risk. You accept full responsibility for any decisions or outcomes arising from your use of this website and agree to release us from any liability in connection with your use of, or reliance upon, the content or products found herein.