
|
Hubei Energy Group Co., Ltd. (000883.sz) Valoración de DCF |
Completamente Editable: Adáptelo A Sus Necesidades En Excel O Sheets
Diseño Profesional: Plantillas Confiables Y Estándares De La Industria
Predeterminadas Para Un Uso Rápido Y Eficiente
Compatible con MAC / PC, completamente desbloqueado
No Se Necesita Experiencia; Fáciles De Seguir
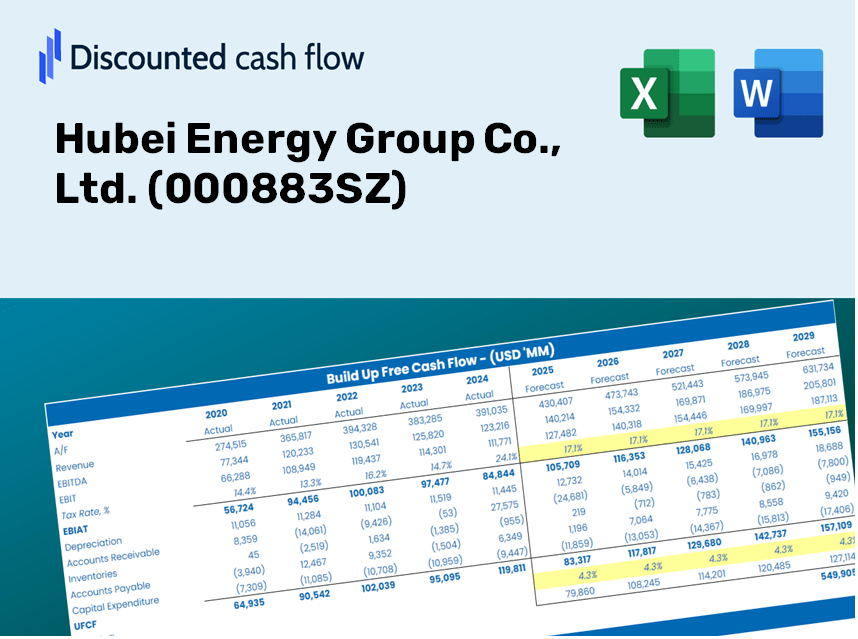
Hubei Energy Group Co., Ltd. (000883.SZ) Bundle
Como inversionista o analista, la calculadora DCF para Hubei Energy Group Co., Ltd. (000883SZ) es su recurso favorito para una valoración precisa. Equipado con datos reales de Hubei Energy, puede ajustar los pronósticos y observar los efectos en tiempo real.
Discounted Cash Flow (DCF) - (USD MM)
| Year | AY1 2020 |
AY2 2021 |
AY3 2022 |
AY4 2023 |
AY5 2024 |
FY1 2025 |
FY2 2026 |
FY3 2027 |
FY4 2028 |
FY5 2029 |
|---|---|---|---|---|---|---|---|---|---|---|
| Revenue | 17,023.4 | 22,628.9 | 20,578.2 | 18,668.7 | 20,030.7 | 21,126.5 | 22,282.2 | 23,501.1 | 24,786.8 | 26,142.7 |
| Revenue Growth, % | 0 | 32.93 | -9.06 | -9.28 | 7.3 | 5.47 | 5.47 | 5.47 | 5.47 | 5.47 |
| EBITDA | 6,111.0 | 5,538.1 | 4,183.4 | 5,460.3 | 7,162.4 | 6,156.5 | 6,493.3 | 6,848.5 | 7,223.1 | 7,618.3 |
| EBITDA, % | 35.9 | 24.47 | 20.33 | 29.25 | 35.76 | 29.14 | 29.14 | 29.14 | 29.14 | 29.14 |
| Depreciation | 2,045.5 | 2,434.5 | 2,175.3 | 2,554.4 | 3,047.7 | 2,629.9 | 2,773.8 | 2,925.6 | 3,085.6 | 3,254.4 |
| Depreciation, % | 12.02 | 10.76 | 10.57 | 13.68 | 15.22 | 12.45 | 12.45 | 12.45 | 12.45 | 12.45 |
| EBIT | 4,065.5 | 3,103.6 | 2,008.0 | 2,905.9 | 4,114.7 | 3,526.5 | 3,719.5 | 3,922.9 | 4,137.5 | 4,363.9 |
| EBIT, % | 23.88 | 13.72 | 9.76 | 15.57 | 20.54 | 16.69 | 16.69 | 16.69 | 16.69 | 16.69 |
| Total Cash | 1,110.6 | 2,262.4 | 2,947.5 | 1,692.1 | 2,268.8 | 2,164.8 | 2,283.3 | 2,408.2 | 2,539.9 | 2,678.8 |
| Total Cash, percent | .0 | .0 | .0 | .0 | .0 | .0 | .0 | .0 | .0 | .0 |
| Account Receivables | 3,201.4 | 4,128.8 | 3,520.5 | 5,369.8 | 5,096.3 | 4,578.8 | 4,829.3 | 5,093.4 | 5,372.1 | 5,666.0 |
| Account Receivables, % | 18.81 | 18.25 | 17.11 | 28.76 | 25.44 | 21.67 | 21.67 | 21.67 | 21.67 | 21.67 |
| Inventories | 415.9 | 789.8 | 660.4 | 717.2 | 1,066.3 | 773.6 | 815.9 | 860.5 | 907.6 | 957.2 |
| Inventories, % | 2.44 | 3.49 | 3.21 | 3.84 | 5.32 | 3.66 | 3.66 | 3.66 | 3.66 | 3.66 |
| Accounts Payable | 913.3 | 1,771.7 | 3,010.7 | 3,349.5 | 3,728.9 | 2,720.4 | 2,869.2 | 3,026.1 | 3,191.7 | 3,366.3 |
| Accounts Payable, % | 5.36 | 7.83 | 14.63 | 17.94 | 18.62 | 12.88 | 12.88 | 12.88 | 12.88 | 12.88 |
| Capital Expenditure | -2,384.2 | -3,409.3 | -6,175.5 | -9,593.0 | -11,045.3 | -6,997.5 | -7,380.2 | -7,784.0 | -8,209.8 | -8,658.9 |
| Capital Expenditure, % | -14.01 | -15.07 | -30.01 | -51.39 | -55.14 | -33.12 | -33.12 | -33.12 | -33.12 | -33.12 |
| Tax Rate, % | 35.27 | 35.27 | 35.27 | 35.27 | 35.27 | 35.27 | 35.27 | 35.27 | 35.27 | 35.27 |
| EBITAT | 2,811.0 | 2,425.0 | 1,435.9 | 2,234.8 | 2,663.4 | 2,542.1 | 2,681.2 | 2,827.8 | 2,982.5 | 3,145.7 |
| Depreciation | ||||||||||
| Changes in Account Receivables | ||||||||||
| Changes in Inventories | ||||||||||
| Changes in Accounts Payable | ||||||||||
| Capital Expenditure | ||||||||||
| UFCF | -231.7 | 1,007.2 | -587.5 | -6,371.1 | -5,030.4 | -2,023.6 | -2,069.3 | -2,182.5 | -2,301.8 | -2,427.8 |
| WACC, % | 3.34 | 3.53 | 3.39 | 3.5 | 3.25 | 3.4 | 3.4 | 3.4 | 3.4 | 3.4 |
| PV UFCF | ||||||||||
| SUM PV UFCF | -9,934.5 | |||||||||
| Long Term Growth Rate, % | 2.00 | |||||||||
| Free cash flow (T + 1) | -2,476 | |||||||||
| Terminal Value | -176,916 | |||||||||
| Present Terminal Value | -149,682 | |||||||||
| Enterprise Value | -159,616 | |||||||||
| Net Debt | 39,820 | |||||||||
| Equity Value | -199,437 | |||||||||
| Diluted Shares Outstanding, MM | 6,479 | |||||||||
| Equity Value Per Share | -30.78 |
What You Will Receive
- Authentic Hubei Energy Data: Preloaded financial information – from revenue to EBIT – based on real and projected figures.
- Complete Customization: Modify all essential parameters (yellow cells) such as WACC, growth %, and tax rates.
- Immediate Valuation Updates: Automatic recalculations to assess the effects of changes on Hubei Energy's fair value.
- Flexible Excel Template: Designed for quick adjustments, scenario analysis, and comprehensive projections.
- Efficient and Accurate: Bypass the need to build models from the ground up while ensuring accuracy and adaptability.
Key Features
- Actual Hubei Energy Data: Pre-loaded with the historical financials and future projections of Hubei Energy Group Co., Ltd. (000883SZ).
- Completely Customizable Inputs: Modify parameters such as revenue growth, profit margins, discount rates, tax rates, and capital expenditures.
- Interactive Valuation Model: Automatically refreshes Net Present Value (NPV) and intrinsic value based on user-defined inputs.
- Scenario Analysis: Develop various forecasting scenarios to explore different valuation possibilities.
- User-Centric Design: Intuitive and organized, catering to both experienced professionals and newcomers.
How It Functions
- Step 1: Download the Excel template.
- Step 2: Examine Hubei Energy Group Co., Ltd.'s (000883SZ) pre-filled financial metrics and projections.
- Step 3: Adjust key inputs such as revenue growth, discount rates, and tax percentages (highlighted cells).
- Step 4: Observe the DCF model refresh in real-time as you modify your assumptions.
- Step 5: Evaluate the results and apply the findings to inform your investment choices.
Why Select Hubei Energy Group's Calculator?
- Time Efficient: Begin your analysis without the hassle of building a DCF model from the ground up – it's ready for immediate use.
- Enhanced Accuracy: Depend on precise financial data and established formulas to minimize valuation errors.
- Completely Customizable: Adjust the model to align with your specific assumptions and forecasts.
- User-Friendly: Intuitive charts and outputs make the analysis straightforward and accessible.
- Endorsed by Professionals: Created for those who prioritize accuracy and practicality in financial assessments.
Who Can Benefit from This Product?
- Investors: Evaluate Hubei Energy Group Co., Ltd.'s (000883SZ) valuation for informed buying or selling decisions.
- CFOs and Financial Analysts: Enhance valuation workflows and validate financial projections.
- Startup Founders: Understand the valuation methods used for established companies like Hubei Energy Group Co., Ltd. (000883SZ).
- Consultants: Provide expert valuation reports tailored for clients focused on Hubei Energy Group Co., Ltd. (000883SZ).
- Students and Educators: Utilize real-time data from Hubei Energy Group Co., Ltd. (000883SZ) to practice and teach valuation methodologies.
Contents of the Template
- Comprehensive DCF Model: Editable template featuring in-depth valuation calculations.
- Real-World Data: Hubei Energy Group Co., Ltd.'s historical and projected financials preloaded for analysis.
- Customizable Parameters: Modify WACC, growth rates, and tax assumptions to explore different scenarios.
- Financial Statements: Complete annual and quarterly breakdowns for enhanced insights.
- Key Ratios: Integrated analysis for assessing profitability, efficiency, and leverage.
- Dashboard with Visual Outputs: Charts and tables to present clear, actionable results.
Disclaimer
All information, articles, and product details provided on this website are for general informational and educational purposes only. We do not claim any ownership over, nor do we intend to infringe upon, any trademarks, copyrights, logos, brand names, or other intellectual property mentioned or depicted on this site. Such intellectual property remains the property of its respective owners, and any references here are made solely for identification or informational purposes, without implying any affiliation, endorsement, or partnership.
We make no representations or warranties, express or implied, regarding the accuracy, completeness, or suitability of any content or products presented. Nothing on this website should be construed as legal, tax, investment, financial, medical, or other professional advice. In addition, no part of this site—including articles or product references—constitutes a solicitation, recommendation, endorsement, advertisement, or offer to buy or sell any securities, franchises, or other financial instruments, particularly in jurisdictions where such activity would be unlawful.
All content is of a general nature and may not address the specific circumstances of any individual or entity. It is not a substitute for professional advice or services. Any actions you take based on the information provided here are strictly at your own risk. You accept full responsibility for any decisions or outcomes arising from your use of this website and agree to release us from any liability in connection with your use of, or reliance upon, the content or products found herein.