
|
Valoración de DCF PCCW Limited (0008.HK) |
Completamente Editable: Adáptelo A Sus Necesidades En Excel O Sheets
Diseño Profesional: Plantillas Confiables Y Estándares De La Industria
Predeterminadas Para Un Uso Rápido Y Eficiente
Compatible con MAC / PC, completamente desbloqueado
No Se Necesita Experiencia; Fáciles De Seguir
PCCW Limited (0008.HK) Bundle
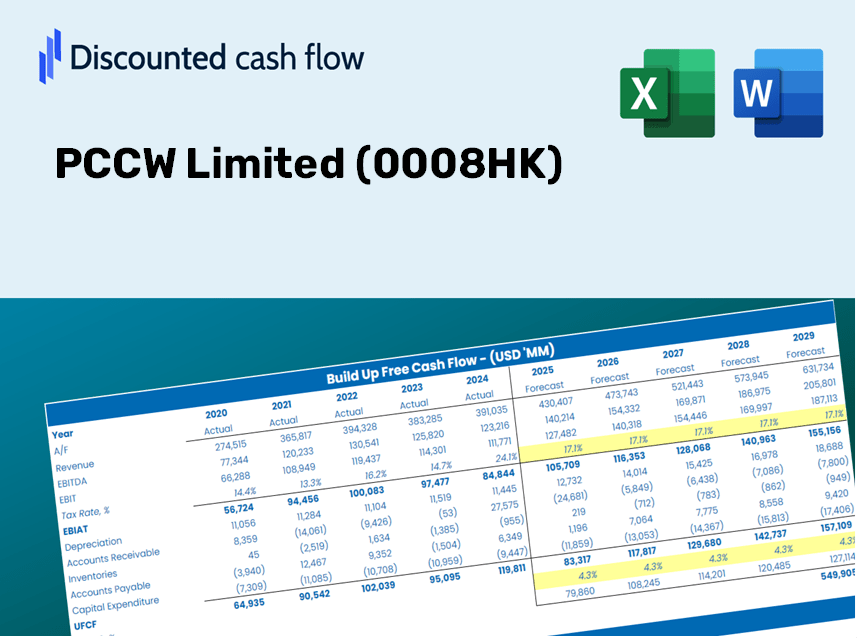
¡Optimice su tiempo y mejore la precisión con nuestra calculadora DCF (0008HK)! Utilizando datos limitados de PCCW reales y supuestos personalizables, esta herramienta le permite pronosticar, analizar y valorar PCCW Limited como un inversor experimentado.
Discounted Cash Flow (DCF) - (USD MM)
| Year | AY1 2020 |
AY2 2021 |
AY3 2022 |
AY4 2023 |
AY5 2024 |
FY1 2025 |
FY2 2026 |
FY3 2027 |
FY4 2028 |
FY5 2029 |
|---|---|---|---|---|---|---|---|---|---|---|
| Revenue | 35,984.0 | 35,455.0 | 36,065.0 | 36,347.0 | 37,557.0 | 37,966.5 | 38,380.5 | 38,798.9 | 39,222.0 | 39,649.6 |
| Revenue Growth, % | 0 | -1.47 | 1.72 | 0.78192 | 3.33 | 1.09 | 1.09 | 1.09 | 1.09 | 1.09 |
| EBITDA | 11,108.0 | 11,855.0 | 12,385.0 | 13,214.0 | 11,218.0 | 12,519.2 | 12,655.7 | 12,793.7 | 12,933.1 | 13,074.2 |
| EBITDA, % | 30.87 | 33.44 | 34.34 | 36.36 | 29.87 | 32.97 | 32.97 | 32.97 | 32.97 | 32.97 |
| Depreciation | 7,399.0 | 7,198.0 | 7,716.0 | 7,863.0 | 5,744.0 | 7,531.5 | 7,613.6 | 7,696.6 | 7,780.5 | 7,865.3 |
| Depreciation, % | 20.56 | 20.3 | 21.39 | 21.63 | 15.29 | 19.84 | 19.84 | 19.84 | 19.84 | 19.84 |
| EBIT | 3,709.0 | 4,657.0 | 4,669.0 | 5,351.0 | 5,474.0 | 4,987.7 | 5,042.1 | 5,097.1 | 5,152.6 | 5,208.8 |
| EBIT, % | 10.31 | 13.13 | 12.95 | 14.72 | 14.58 | 13.14 | 13.14 | 13.14 | 13.14 | 13.14 |
| Total Cash | 4,619.0 | 5,036.0 | 3,125.0 | 2,706.0 | 2,583.0 | 3,798.7 | 3,840.2 | 3,882.0 | 3,924.4 | 3,967.1 |
| Total Cash, percent | .0 | .0 | .0 | .0 | .0 | .0 | .0 | .0 | .0 | .0 |
| Account Receivables | 7,074.0 | 8,792.0 | 7,588.0 | 5,664.0 | 5,411.0 | 7,250.6 | 7,329.6 | 7,409.6 | 7,490.4 | 7,572.0 |
| Account Receivables, % | 19.66 | 24.8 | 21.04 | 15.58 | 14.41 | 19.1 | 19.1 | 19.1 | 19.1 | 19.1 |
| Inventories | 1,360.0 | 1,444.0 | 2,065.0 | 1,608.0 | 2,122.0 | 1,796.0 | 1,815.6 | 1,835.4 | 1,855.4 | 1,875.6 |
| Inventories, % | 3.78 | 4.07 | 5.73 | 4.42 | 5.65 | 4.73 | 4.73 | 4.73 | 4.73 | 4.73 |
| Accounts Payable | 4,418.0 | 5,770.0 | 6,074.0 | 6,297.0 | 7,570.0 | 6,292.9 | 6,361.5 | 6,430.9 | 6,501.0 | 6,571.9 |
| Accounts Payable, % | 12.28 | 16.27 | 16.84 | 17.32 | 20.16 | 16.57 | 16.57 | 16.57 | 16.57 | 16.57 |
| Capital Expenditure | -7,126.0 | -7,919.0 | -6,906.0 | -8,023.0 | -7,549.0 | -7,856.1 | -7,941.7 | -8,028.3 | -8,115.9 | -8,204.4 |
| Capital Expenditure, % | -19.8 | -22.34 | -19.15 | -22.07 | -20.1 | -20.69 | -20.69 | -20.69 | -20.69 | -20.69 |
| Tax Rate, % | 102.37 | 102.37 | 102.37 | 102.37 | 102.37 | 102.37 | 102.37 | 102.37 | 102.37 | 102.37 |
| EBITAT | -1,816.2 | 1,572.6 | 706.0 | -1,008.5 | -129.6 | 487.7 | 493.0 | 498.4 | 503.8 | 509.3 |
| Depreciation | ||||||||||
| Changes in Account Receivables | ||||||||||
| Changes in Inventories | ||||||||||
| Changes in Accounts Payable | ||||||||||
| Capital Expenditure | ||||||||||
| UFCF | -5,559.2 | 401.6 | 2,403.0 | 1,435.5 | -922.6 | -2,627.6 | 134.8 | 136.3 | 137.8 | 139.3 |
| WACC, % | 2.28 | 3.27 | 2.72 | 2.28 | 2.28 | 2.57 | 2.57 | 2.57 | 2.57 | 2.57 |
| PV UFCF | ||||||||||
| SUM PV UFCF | -2,060.1 | |||||||||
| Long Term Growth Rate, % | 2.00 | |||||||||
| Free cash flow (T + 1) | 142 | |||||||||
| Terminal Value | 24,978 | |||||||||
| Present Terminal Value | 22,003 | |||||||||
| Enterprise Value | 19,943 | |||||||||
| Net Debt | 51,653 | |||||||||
| Equity Value | -31,710 | |||||||||
| Diluted Shares Outstanding, MM | 7,731 | |||||||||
| Equity Value Per Share | -4.10 |
Your Benefits
- Customizable Excel Template: A fully adjustable Excel-based DCF Calculator featuring pre-populated financial data for PCCW Limited (0008HK).
- Authentic Data: Access to historical figures and projected estimates (highlighted in the yellow cells).
- Adaptive Forecasting: Modify forecast parameters such as revenue growth, EBITDA %, and WACC.
- Instant Calculations: Quickly assess how your inputs affect PCCW Limited’s (0008HK) valuation.
- Professional Tool: Designed for investors, CFOs, consultants, and financial analysts.
- Intuitive Interface: Organized for clarity and simplicity, complete with step-by-step guidance.
Key Features
- 🔍 Real-Life PCCW Financials: Pre-filled historical and projected data for PCCW Limited (0008HK).
- ✏️ Fully Customizable Inputs: Modify all essential parameters (yellow cells) such as WACC, growth %, and tax rates.
- 📊 Professional DCF Valuation: Built-in formulas compute PCCW’s intrinsic value using the Discounted Cash Flow method.
- ⚡ Instant Results: Visualize PCCW’s valuation immediately after making adjustments.
- Scenario Analysis: Explore and compare outcomes for different financial assumptions side-by-side.
How It Works
- Step 1: Download the prebuilt Excel template containing PCCW Limited’s data.
- Step 2: Familiarize yourself with the pre-filled sheets and key performance indicators.
- Step 3: Modify forecasts and assumptions in the editable yellow cells (WACC, growth, margins).
- Step 4: Instantly view the recalculated results, including PCCW Limited’s intrinsic value.
- Step 5: Use the outputs to make informed investment decisions or create reports.
Why Opt for This Calculator?
- Designed for Experts: A sophisticated tool utilized by analysts, CFOs, and consultants.
- Comprehensive Data: PCCW Limited’s historical and projected financials are preloaded for precision.
- Flexible Scenario Testing: Effortlessly simulate various forecasts and assumptions.
- Transparent Outputs: Automatically computes intrinsic value, NPV, and essential metrics.
- User-Friendly: Step-by-step guidance walks you through each stage of the process.
Who Should Utilize This Product?
- Investors: Evaluate PCCW Limited's (0008HK) valuation prior to making buy or sell decisions.
- CFOs and Financial Analysts: Optimize valuation methodologies and assess financial projections.
- Startup Founders: Understand how leading public companies like PCCW Limited are valued in the market.
- Consultants: Create comprehensive valuation reports for your clients based on PCCW Limited (0008HK).
- Students and Educators: Apply real-world data from PCCW Limited (0008HK) to enhance valuation skills and teaching methods.
Contents of the Template
- Preloaded PCCW Data: Historical and projected financial information, covering revenue, EBIT, and capital expenditures.
- DCF and WACC Models: Professional-quality sheets for determining intrinsic value and Weighted Average Cost of Capital.
- Editable Inputs: Yellow-highlighted cells to modify revenue growth, tax rates, and discount rates.
- Financial Statements: Detailed annual and quarterly financials for thorough analysis.
- Key Ratios: Ratios for profitability, leverage, and efficiency to assess performance.
- Dashboard and Charts: Visual representations of valuation results and underlying assumptions.
Disclaimer
All information, articles, and product details provided on this website are for general informational and educational purposes only. We do not claim any ownership over, nor do we intend to infringe upon, any trademarks, copyrights, logos, brand names, or other intellectual property mentioned or depicted on this site. Such intellectual property remains the property of its respective owners, and any references here are made solely for identification or informational purposes, without implying any affiliation, endorsement, or partnership.
We make no representations or warranties, express or implied, regarding the accuracy, completeness, or suitability of any content or products presented. Nothing on this website should be construed as legal, tax, investment, financial, medical, or other professional advice. In addition, no part of this site—including articles or product references—constitutes a solicitation, recommendation, endorsement, advertisement, or offer to buy or sell any securities, franchises, or other financial instruments, particularly in jurisdictions where such activity would be unlawful.
All content is of a general nature and may not address the specific circumstances of any individual or entity. It is not a substitute for professional advice or services. Any actions you take based on the information provided here are strictly at your own risk. You accept full responsibility for any decisions or outcomes arising from your use of this website and agree to release us from any liability in connection with your use of, or reliance upon, the content or products found herein.