
|
FSPG HI-Tech CO., Ltd. (000973.sz) Valoración de DCF |
Completamente Editable: Adáptelo A Sus Necesidades En Excel O Sheets
Diseño Profesional: Plantillas Confiables Y Estándares De La Industria
Predeterminadas Para Un Uso Rápido Y Eficiente
Compatible con MAC / PC, completamente desbloqueado
No Se Necesita Experiencia; Fáciles De Seguir
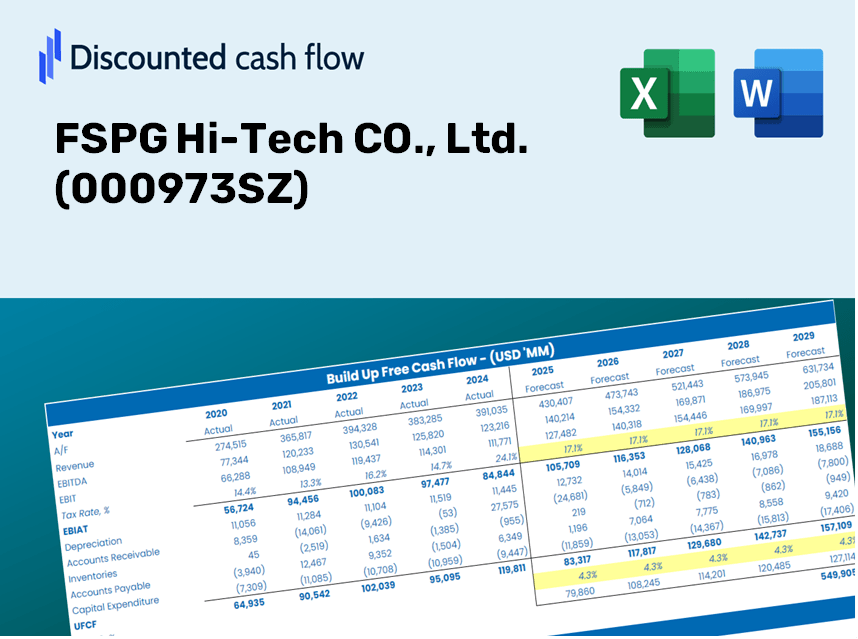
FSPG Hi-Tech CO., Ltd. (000973.SZ) Bundle
¡Explore el futuro financiero de FSPG Hi-Tech Co., Ltd. (000973SZ) con nuestra calculadora DCF fácil de usar! Ingrese sus proyecciones para el crecimiento, los márgenes y los gastos para calcular el valor intrínseco de FSPG Hi-Tech Co., Ltd. (000973SZ) y refinar su estrategia de inversión.
Discounted Cash Flow (DCF) - (USD MM)
| Year | AY1 2020 |
AY2 2021 |
AY3 2022 |
AY4 2023 |
AY5 2024 |
FY1 2025 |
FY2 2026 |
FY3 2027 |
FY4 2028 |
FY5 2029 |
|---|---|---|---|---|---|---|---|---|---|---|
| Revenue | 2,299.4 | 2,457.3 | 2,635.1 | 2,214.6 | 2,228.0 | 2,221.0 | 2,214.1 | 2,207.2 | 2,200.3 | 2,193.4 |
| Revenue Growth, % | 0 | 6.87 | 7.24 | -15.96 | 0.60517 | -0.31244 | -0.31244 | -0.31244 | -0.31244 | -0.31244 |
| EBITDA | 336.1 | 333.2 | 303.2 | 263.0 | 265.2 | 281.9 | 281.0 | 280.2 | 279.3 | 278.4 |
| EBITDA, % | 14.62 | 13.56 | 11.51 | 11.87 | 11.9 | 12.69 | 12.69 | 12.69 | 12.69 | 12.69 |
| Depreciation | 133.4 | 125.8 | 132.1 | 120.7 | 123.5 | 119.6 | 119.2 | 118.9 | 118.5 | 118.1 |
| Depreciation, % | 5.8 | 5.12 | 5.01 | 5.45 | 5.54 | 5.39 | 5.39 | 5.39 | 5.39 | 5.39 |
| EBIT | 202.7 | 207.5 | 171.1 | 142.3 | 141.7 | 162.3 | 161.8 | 161.3 | 160.8 | 160.3 |
| EBIT, % | 8.82 | 8.44 | 6.49 | 6.43 | 6.36 | 7.31 | 7.31 | 7.31 | 7.31 | 7.31 |
| Total Cash | 501.0 | 599.6 | 1,099.6 | 1,044.9 | 893.0 | 778.2 | 775.7 | 773.3 | 770.9 | 768.5 |
| Total Cash, percent | .0 | .0 | .0 | .0 | .0 | .0 | .0 | .0 | .0 | .0 |
| Account Receivables | 354.9 | 411.6 | 445.7 | 424.9 | 451.3 | 393.3 | 392.1 | 390.8 | 389.6 | 388.4 |
| Account Receivables, % | 15.44 | 16.75 | 16.91 | 19.19 | 20.25 | 17.71 | 17.71 | 17.71 | 17.71 | 17.71 |
| Inventories | 426.6 | 430.2 | 520.7 | 467.8 | 415.6 | 424.7 | 423.3 | 422.0 | 420.7 | 419.4 |
| Inventories, % | 18.55 | 17.51 | 19.76 | 21.13 | 18.65 | 19.12 | 19.12 | 19.12 | 19.12 | 19.12 |
| Accounts Payable | 195.2 | 202.2 | 2.0 | 257.7 | 251.3 | 176.4 | 175.8 | 175.3 | 174.7 | 174.2 |
| Accounts Payable, % | 8.49 | 8.23 | 0.07745182 | 11.64 | 11.28 | 7.94 | 7.94 | 7.94 | 7.94 | 7.94 |
| Capital Expenditure | -91.1 | -90.9 | -75.0 | -299.4 | -207.7 | -148.1 | -147.7 | -147.2 | -146.8 | -146.3 |
| Capital Expenditure, % | -3.96 | -3.7 | -2.84 | -13.52 | -9.32 | -6.67 | -6.67 | -6.67 | -6.67 | -6.67 |
| Tax Rate, % | 26.94 | 26.94 | 26.94 | 26.94 | 26.94 | 26.94 | 26.94 | 26.94 | 26.94 | 26.94 |
| EBITAT | 130.4 | 148.4 | 121.3 | 121.2 | 103.5 | 118.5 | 118.1 | 117.7 | 117.4 | 117.0 |
| Depreciation | ||||||||||
| Changes in Account Receivables | ||||||||||
| Changes in Inventories | ||||||||||
| Changes in Accounts Payable | ||||||||||
| Capital Expenditure | ||||||||||
| UFCF | -413.7 | 130.1 | -146.4 | 271.7 | 38.9 | 63.9 | 91.7 | 91.4 | 91.1 | 90.8 |
| WACC, % | 5.47 | 5.49 | 5.49 | 5.54 | 5.5 | 5.5 | 5.5 | 5.5 | 5.5 | 5.5 |
| PV UFCF | ||||||||||
| SUM PV UFCF | 363.8 | |||||||||
| Long Term Growth Rate, % | 2.00 | |||||||||
| Free cash flow (T + 1) | 93 | |||||||||
| Terminal Value | 2,648 | |||||||||
| Present Terminal Value | 2,027 | |||||||||
| Enterprise Value | 2,390 | |||||||||
| Net Debt | -219 | |||||||||
| Equity Value | 2,610 | |||||||||
| Diluted Shares Outstanding, MM | 997 | |||||||||
| Equity Value Per Share | 2.62 |
What You Will Receive
- Authentic FSPG Financial Data: Access historical and projected figures for precise valuation.
- Customizable Parameters: Adjust WACC, tax rates, revenue growth, and capital investments as needed.
- Automated Calculations: Dynamic computation of intrinsic value and NPV.
- Scenario Analysis: Explore various scenarios to assess FSPG's future outcomes.
- User-Friendly Design: Tailored for professionals while remaining approachable for newcomers.
Core Features
- Customizable Forecast Inputs: Adjust essential metrics such as revenue growth, EBITDA margin, and capital expenditures with ease.
- Instant DCF Valuation: Quickly computes intrinsic value, NPV, and other key outputs automatically.
- Industry-Leading Precision: Leverages FSPG Hi-Tech CO., Ltd.'s (000973SZ) real financial data for reliable valuation results.
- Simplified Scenario Analysis: Effortlessly evaluate various assumptions and juxtapose results.
- Efficiency Boost: Remove the complexity of creating intricate valuation models from the ground up.
How It Works
- Download the Template: Gain immediate access to the Excel-based FSPG DCF Calculator.
- Input Your Assumptions: Modify the yellow-highlighted cells for growth rates, WACC, profit margins, and other variables.
- Instant Calculations: The model will automatically recalculate FSPG's intrinsic value based on your inputs.
- Test Scenarios: Experiment with various assumptions to assess how they impact valuation.
- Analyze and Decide: Leverage the results to support your investment or financial decision-making.
Why Choose FSPG Hi-Tech CO., Ltd. (000973SZ) Calculator?
- All-in-One Solution: Combines DCF, WACC, and financial ratio analyses in a single platform.
- Flexible Inputs: Modify the highlighted fields to explore different financial scenarios.
- In-Depth Analysis: Automatically determines FSPG Hi-Tech’s intrinsic value and Net Present Value.
- Loaded with Data: Historical and projected data provide reliable starting points for analysis.
- High-Caliber Tool: Perfect for financial analysts, investors, and business consultants.
Who Should Benefit from FSPG Hi-Tech CO., Ltd. (000973SZ)?
- Investors: Evaluate FSPG Hi-Tech’s valuation to inform buying or selling decisions.
- CFOs and Financial Analysts: Optimize valuation methodologies and validate financial forecasts.
- Startup Founders: Gain insights into how leading tech companies like FSPG Hi-Tech are valued.
- Consultants: Create comprehensive valuation reports for your clients based on FSPG Hi-Tech’s data.
- Students and Educators: Utilize current data to explore and teach valuation strategies.
Contents of the Template
- Pre-Filled DCF Model: FSPG Hi-Tech CO., Ltd.’s financial data preloaded for immediate access.
- WACC Calculator: Comprehensive calculations for Weighted Average Cost of Capital.
- Financial Ratios: Assess FSPG Hi-Tech CO., Ltd.’s profitability, leverage, and operational efficiency.
- Editable Inputs: Adjust assumptions such as growth rates, margins, and CAPEX to tailor your analyses.
- Financial Statements: Annual and quarterly reports provided for in-depth examination.
- Interactive Dashboard: Streamlined visualization of essential valuation metrics and outcomes.
Disclaimer
All information, articles, and product details provided on this website are for general informational and educational purposes only. We do not claim any ownership over, nor do we intend to infringe upon, any trademarks, copyrights, logos, brand names, or other intellectual property mentioned or depicted on this site. Such intellectual property remains the property of its respective owners, and any references here are made solely for identification or informational purposes, without implying any affiliation, endorsement, or partnership.
We make no representations or warranties, express or implied, regarding the accuracy, completeness, or suitability of any content or products presented. Nothing on this website should be construed as legal, tax, investment, financial, medical, or other professional advice. In addition, no part of this site—including articles or product references—constitutes a solicitation, recommendation, endorsement, advertisement, or offer to buy or sell any securities, franchises, or other financial instruments, particularly in jurisdictions where such activity would be unlawful.
All content is of a general nature and may not address the specific circumstances of any individual or entity. It is not a substitute for professional advice or services. Any actions you take based on the information provided here are strictly at your own risk. You accept full responsibility for any decisions or outcomes arising from your use of this website and agree to release us from any liability in connection with your use of, or reliance upon, the content or products found herein.