
|
Guangzhou Yuexiu Financial Holdings Group Co., Ltd. (000987.SZ) Valoración de DCF |
Completamente Editable: Adáptelo A Sus Necesidades En Excel O Sheets
Diseño Profesional: Plantillas Confiables Y Estándares De La Industria
Predeterminadas Para Un Uso Rápido Y Eficiente
Compatible con MAC / PC, completamente desbloqueado
No Se Necesita Experiencia; Fáciles De Seguir
Guangzhou Yuexiu Financial Holdings Group Co., Ltd. (000987.SZ) Bundle
¡Simplifique la valoración de Guangzhou Yuexiu Financial Holdings Group Co., Ltd. (000987SZ) con esta calculadora DCF personalizable! Con el verdadero Guangzhou Yuexiu Financial Holdings Group Co., Ltd. (000987SZ) Financials y las entradas de pronóstico ajustables, puede probar escenarios y descubrir Guangzhou Yuexiu Financial Holdings Group Co., Ltd. (000987sz) valor justo en minutos.
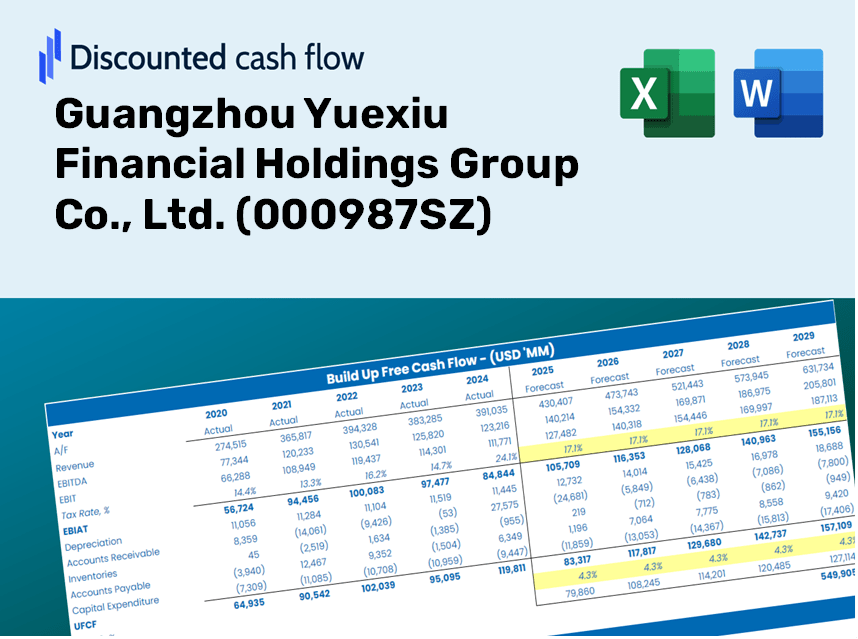
Discounted Cash Flow (DCF) - (USD MM)
| Year | AY1 2020 |
AY2 2021 |
AY3 2022 |
AY4 2023 |
AY5 2024 |
FY1 2025 |
FY2 2026 |
FY3 2027 |
FY4 2028 |
FY5 2029 |
|---|---|---|---|---|---|---|---|---|---|---|
| Revenue | 9,686.7 | 13,313.9 | 14,171.4 | 10,387.5 | 13,235.5 | 14,711.4 | 16,351.8 | 18,175.2 | 20,201.8 | 22,454.5 |
| Revenue Growth, % | 0 | 37.44 | 6.44 | -26.7 | 27.42 | 11.15 | 11.15 | 11.15 | 11.15 | 11.15 |
| EBITDA | 1,672.7 | 2,588.9 | 6,215.6 | 5,656.3 | 4,674.6 | 5,012.0 | 5,570.9 | 6,192.1 | 6,882.5 | 7,650.0 |
| EBITDA, % | 17.27 | 19.44 | 43.86 | 54.45 | 35.32 | 34.07 | 34.07 | 34.07 | 34.07 | 34.07 |
| Depreciation | 4,324.4 | 7,580.0 | 8,501.1 | 326.8 | 1,202.4 | 5,113.5 | 5,683.7 | 6,317.5 | 7,021.9 | 7,804.9 |
| Depreciation, % | 44.64 | 56.93 | 59.99 | 3.15 | 9.08 | 34.76 | 34.76 | 34.76 | 34.76 | 34.76 |
| EBIT | -2,651.7 | -4,991.1 | -2,285.5 | 5,329.6 | 3,472.2 | -101.5 | -112.8 | -125.4 | -139.4 | -154.9 |
| EBIT, % | -27.37 | -37.49 | -16.13 | 51.31 | 26.23 | -0.6898 | -0.6898 | -0.6898 | -0.6898 | -0.6898 |
| Total Cash | 39,409.8 | 56,558.4 | 59,929.9 | 63,420.3 | 75,292.0 | 14,711.4 | 16,351.8 | 18,175.2 | 20,201.8 | 22,454.5 |
| Total Cash, percent | .0 | .0 | .0 | .0 | .0 | .0 | .0 | .0 | .0 | .0 |
| Account Receivables | 701.6 | 533.0 | 614.8 | .0 | 1,240.6 | 734.3 | 816.2 | 907.2 | 1,008.4 | 1,120.8 |
| Account Receivables, % | 7.24 | 4 | 4.34 | 0 | 9.37 | 4.99 | 4.99 | 4.99 | 4.99 | 4.99 |
| Inventories | 381.3 | 1,100.8 | 961.2 | 1,179.3 | 1,678.3 | 1,265.8 | 1,406.9 | 1,563.8 | 1,738.2 | 1,932.0 |
| Inventories, % | 3.94 | 8.27 | 6.78 | 11.35 | 12.68 | 8.6 | 8.6 | 8.6 | 8.6 | 8.6 |
| Accounts Payable | 503.0 | .0 | .0 | .0 | 9,455.7 | 2,254.8 | 2,506.2 | 2,785.7 | 3,096.3 | 3,441.6 |
| Accounts Payable, % | 5.19 | 0 | 0 | 0 | 71.44 | 15.33 | 15.33 | 15.33 | 15.33 | 15.33 |
| Capital Expenditure | -33.7 | -44.0 | -1,254.6 | -9,980.4 | -25,322.1 | -6,049.7 | -6,724.3 | -7,474.1 | -8,307.5 | -9,233.9 |
| Capital Expenditure, % | -0.3481 | -0.33065 | -8.85 | -96.08 | -191.32 | -41.12 | -41.12 | -41.12 | -41.12 | -41.12 |
| Tax Rate, % | 27.87 | 27.87 | 27.87 | 27.87 | 27.87 | 27.87 | 27.87 | 27.87 | 27.87 | 27.87 |
| EBITAT | -1,958.1 | -4,074.2 | -1,830.7 | 3,167.0 | 2,504.3 | -74.5 | -82.8 | -92.1 | -102.3 | -113.7 |
| Depreciation | ||||||||||
| Changes in Account Receivables | ||||||||||
| Changes in Inventories | ||||||||||
| Changes in Accounts Payable | ||||||||||
| Capital Expenditure | ||||||||||
| UFCF | 1,752.7 | 2,407.9 | 5,473.6 | -6,090.0 | -13,899.3 | -7,292.8 | -1,095.0 | -1,217.1 | -1,352.8 | -1,503.7 |
| WACC, % | 3.75 | 3.95 | 3.91 | 3.37 | 3.7 | 3.74 | 3.74 | 3.74 | 3.74 | 3.74 |
| PV UFCF | ||||||||||
| SUM PV UFCF | -11,557.9 | |||||||||
| Long Term Growth Rate, % | 2.00 | |||||||||
| Free cash flow (T + 1) | -1,534 | |||||||||
| Terminal Value | -88,331 | |||||||||
| Present Terminal Value | -73,529 | |||||||||
| Enterprise Value | -85,087 | |||||||||
| Net Debt | 79,230 | |||||||||
| Equity Value | -164,316 | |||||||||
| Diluted Shares Outstanding, MM | 5,008 | |||||||||
| Equity Value Per Share | -32.81 |
What You Will Receive
- Pre-Loaded Financial Model: Leverage Guangzhou Yuexiu Financial Holdings Group Co., Ltd.'s actual data for accurate DCF valuation.
- Comprehensive Forecasting Control: Modify revenue growth, profit margins, WACC, and other essential factors.
- Real-Time Calculations: Automatic updates provide immediate insights as you adjust parameters.
- Professional-Grade Template: A polished Excel file tailored for sophisticated valuation assessments.
- Flexible and Reusable: Designed for adaptability, facilitating recurrent use for in-depth financial predictions.
Key Features
- 🔍 Real-Life 000987SZ Financials: Pre-filled historical and projected data for Guangzhou Yuexiu Financial Holdings Group Co., Ltd.
- ✏️ Fully Customizable Inputs: Modify all essential parameters (yellow cells) such as WACC, growth %, and tax rates.
- 📊 Professional DCF Valuation: Integrated formulas determine the intrinsic value of Guangzhou Yuexiu using the Discounted Cash Flow method.
- ⚡ Instant Results: See Guangzhou Yuexiu’s valuation updated immediately upon adjustments.
- Scenario Analysis: Evaluate and compare different financial assumptions side-by-side.
How It Works
- Step 1: Download the Excel file.
- Step 2: Examine the pre-filled financial data and forecasts for Guangzhou Yuexiu Financial Holdings Group Co., Ltd. (000987SZ).
- Step 3: Adjust key inputs such as revenue growth, WACC, and tax rates (highlighted cells).
- Step 4: Observe the DCF model update in real-time as you modify your assumptions.
- Step 5: Review the outputs and leverage the findings for your investment strategies.
Why Opt for This Calculator?
- Designed for Professionals: A sophisticated tool trusted by analysts, CFOs, and consultants.
- Comprehensive Data: Preloaded historical and projected financials of Guangzhou Yuexiu Financial Holdings Group Co., Ltd. (000987SZ) for reliable results.
- Flexible Scenario Analysis: Effortlessly test various forecasts and assumptions.
- Intuitive Outputs: Automatically calculates intrinsic value, NPV, and other crucial metrics.
- User-Friendly: Step-by-step guidance ensures a smooth experience.
Who Should Use This Product?
- Finance Students: Explore valuation techniques and apply them with real-world data from Guangzhou Yuexiu Financial Holdings Group Co., Ltd. (000987SZ).
- Academics: Integrate professional financial models into your curriculum or research projects involving (000987SZ).
- Investors: Evaluate your own assumptions and analyze valuation outcomes for Guangzhou Yuexiu Financial Holdings Group Co., Ltd. (000987SZ).
- Analysts: Enhance your efficiency with a customizable DCF model tailored for (000987SZ).
- Small Business Owners: Discover how major public companies like Guangzhou Yuexiu Financial Holdings Group Co., Ltd. (000987SZ) are assessed in the market.
Overview of the Template Features
- Extensive DCF Model: Editable framework with in-depth valuation metrics.
- Real-World Data: Guangzhou Yuexiu Financial Holdings Group Co., Ltd.'s (000987SZ) historical and projected financial data included for analysis.
- Adjustable Parameters: Modify WACC, growth rates, and tax assumptions to explore different scenarios.
- Financial Statements: Complete annual and quarterly breakdowns for enhanced insights.
- Essential Ratios: Integrated analysis for profitability, efficiency, and leverage assessments.
- Visual Dashboard: Graphs and tables that provide clear, actionable insights.
Disclaimer
All information, articles, and product details provided on this website are for general informational and educational purposes only. We do not claim any ownership over, nor do we intend to infringe upon, any trademarks, copyrights, logos, brand names, or other intellectual property mentioned or depicted on this site. Such intellectual property remains the property of its respective owners, and any references here are made solely for identification or informational purposes, without implying any affiliation, endorsement, or partnership.
We make no representations or warranties, express or implied, regarding the accuracy, completeness, or suitability of any content or products presented. Nothing on this website should be construed as legal, tax, investment, financial, medical, or other professional advice. In addition, no part of this site—including articles or product references—constitutes a solicitation, recommendation, endorsement, advertisement, or offer to buy or sell any securities, franchises, or other financial instruments, particularly in jurisdictions where such activity would be unlawful.
All content is of a general nature and may not address the specific circumstances of any individual or entity. It is not a substitute for professional advice or services. Any actions you take based on the information provided here are strictly at your own risk. You accept full responsibility for any decisions or outcomes arising from your use of this website and agree to release us from any liability in connection with your use of, or reliance upon, the content or products found herein.