
|
Chengzhi Accioning Co., Ltd. (000990.sz) Valoración de DCF |
Completamente Editable: Adáptelo A Sus Necesidades En Excel O Sheets
Diseño Profesional: Plantillas Confiables Y Estándares De La Industria
Predeterminadas Para Un Uso Rápido Y Eficiente
Compatible con MAC / PC, completamente desbloqueado
No Se Necesita Experiencia; Fáciles De Seguir
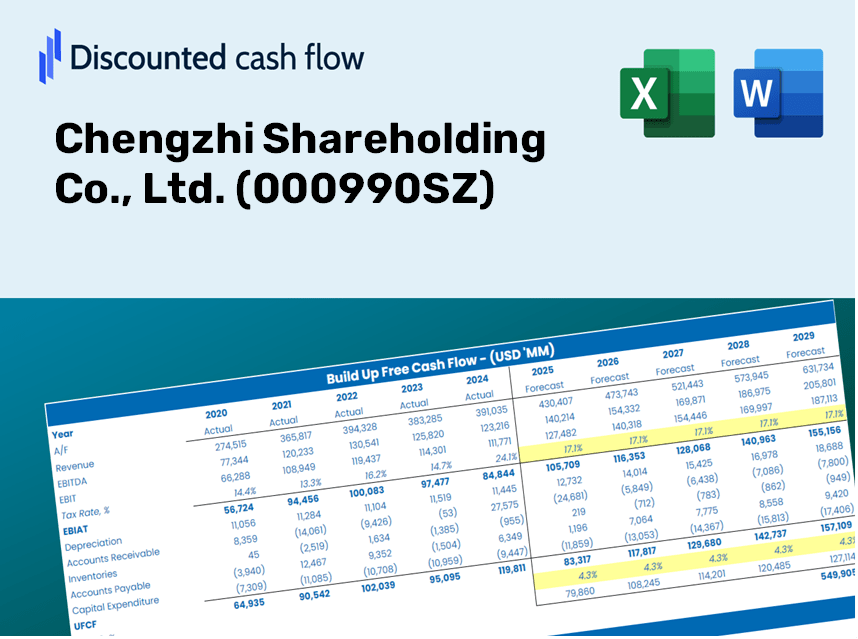
Chengzhi Shareholding Co., Ltd. (000990.SZ) Bundle
¡Explore las perspectivas financieras de Chengzhi Accioning Co., Ltd. (000990SZ) con nuestra calculadora DCF fácil de usar! Ingrese sus suposiciones con respecto al crecimiento, los márgenes y los gastos para calcular el valor intrínseco de Chengzhi Accioning Co., Ltd. (000990SZ) y mejorar su estrategia de inversión.
Discounted Cash Flow (DCF) - (USD MM)
| Year | AY1 2020 |
AY2 2021 |
AY3 2022 |
AY4 2023 |
AY5 2024 |
FY1 2025 |
FY2 2026 |
FY3 2027 |
FY4 2028 |
FY5 2029 |
|---|---|---|---|---|---|---|---|---|---|---|
| Revenue | 9,731.8 | 12,183.9 | 11,717.3 | 12,417.4 | 11,066.1 | 11,521.5 | 11,995.6 | 12,489.2 | 13,003.2 | 13,538.3 |
| Revenue Growth, % | 0 | 25.2 | -3.83 | 5.97 | -10.88 | 4.12 | 4.12 | 4.12 | 4.12 | 4.12 |
| EBITDA | 1,376.8 | 2,277.1 | 967.0 | 1,346.5 | 1,298.3 | 1,467.0 | 1,527.4 | 1,590.3 | 1,655.7 | 1,723.8 |
| EBITDA, % | 14.15 | 18.69 | 8.25 | 10.84 | 11.73 | 12.73 | 12.73 | 12.73 | 12.73 | 12.73 |
| Depreciation | 621.1 | 621.0 | 592.8 | 588.7 | 582.2 | 611.6 | 636.7 | 662.9 | 690.2 | 718.6 |
| Depreciation, % | 6.38 | 5.1 | 5.06 | 4.74 | 5.26 | 5.31 | 5.31 | 5.31 | 5.31 | 5.31 |
| EBIT | 755.7 | 1,656.1 | 374.2 | 757.8 | 716.1 | 855.5 | 890.7 | 927.3 | 965.5 | 1,005.2 |
| EBIT, % | 7.77 | 13.59 | 3.19 | 6.1 | 6.47 | 7.42 | 7.42 | 7.42 | 7.42 | 7.42 |
| Total Cash | 1,854.6 | 1,816.2 | 1,918.5 | 3,807.5 | 3,162.7 | 2,525.1 | 2,629.0 | 2,737.2 | 2,849.8 | 2,967.1 |
| Total Cash, percent | .0 | .0 | .0 | .0 | .0 | .0 | .0 | .0 | .0 | .0 |
| Account Receivables | 1,550.1 | 1,145.2 | 1,691.0 | 1,302.9 | 1,290.6 | 1,426.7 | 1,485.4 | 1,546.5 | 1,610.2 | 1,676.4 |
| Account Receivables, % | 15.93 | 9.4 | 14.43 | 10.49 | 11.66 | 12.38 | 12.38 | 12.38 | 12.38 | 12.38 |
| Inventories | 869.2 | 1,128.2 | 860.5 | 863.6 | 910.4 | 938.2 | 976.8 | 1,017.0 | 1,058.9 | 1,102.5 |
| Inventories, % | 8.93 | 9.26 | 7.34 | 6.95 | 8.23 | 8.14 | 8.14 | 8.14 | 8.14 | 8.14 |
| Accounts Payable | 1,206.6 | 923.5 | 800.4 | 1,202.4 | 1,173.4 | 1,085.2 | 1,129.9 | 1,176.4 | 1,224.8 | 1,275.2 |
| Accounts Payable, % | 12.4 | 7.58 | 6.83 | 9.68 | 10.6 | 9.42 | 9.42 | 9.42 | 9.42 | 9.42 |
| Capital Expenditure | -300.7 | -417.4 | -334.6 | -899.0 | -1,199.7 | -632.6 | -658.6 | -685.7 | -713.9 | -743.3 |
| Capital Expenditure, % | -3.09 | -3.43 | -2.86 | -7.24 | -10.84 | -5.49 | -5.49 | -5.49 | -5.49 | -5.49 |
| Tax Rate, % | 48.07 | 48.07 | 48.07 | 48.07 | 48.07 | 48.07 | 48.07 | 48.07 | 48.07 | 48.07 |
| EBITAT | 603.2 | 1,291.0 | 114.4 | 371.7 | 371.9 | 495.0 | 515.4 | 536.6 | 558.7 | 581.7 |
| Depreciation | ||||||||||
| Changes in Account Receivables | ||||||||||
| Changes in Inventories | ||||||||||
| Changes in Accounts Payable | ||||||||||
| Capital Expenditure | ||||||||||
| UFCF | -289.0 | 1,357.3 | -28.4 | 848.4 | -309.2 | 222.0 | 440.9 | 459.0 | 477.9 | 497.6 |
| WACC, % | 4.56 | 4.53 | 3.88 | 4.14 | 4.17 | 4.26 | 4.26 | 4.26 | 4.26 | 4.26 |
| PV UFCF | ||||||||||
| SUM PV UFCF | 1,832.0 | |||||||||
| Long Term Growth Rate, % | 3.00 | |||||||||
| Free cash flow (T + 1) | 513 | |||||||||
| Terminal Value | 40,776 | |||||||||
| Present Terminal Value | 33,104 | |||||||||
| Enterprise Value | 34,936 | |||||||||
| Net Debt | 3,726 | |||||||||
| Equity Value | 31,210 | |||||||||
| Diluted Shares Outstanding, MM | 1,215 | |||||||||
| Equity Value Per Share | 25.68 |
What You Will Receive
- Authentic 000990SZ Financial Data: Pre-filled with Chengzhi Shareholding Co., Ltd.’s historical and forecasted data for accurate analysis.
- Fully Customizable Template: Easily adjust critical inputs such as revenue growth, WACC, and EBITDA margin.
- Instant Calculations: Instantly see updates to Chengzhi’s intrinsic value based on your modifications.
- Expert Valuation Tool: Crafted for investors, analysts, and consultants in need of reliable DCF results.
- User-Friendly Interface: Streamlined layout and straightforward instructions suitable for all skill levels.
Key Features
- Comprehensive Chengzhi Financials: Gain access to precise pre-loaded historical data and future forecasts.
- Flexible Projection Assumptions: Modify highlighted cells for key metrics such as WACC, growth rates, and profit margins.
- Automated Calculations: Enjoy real-time updates for DCF, Net Present Value (NPV), and cash flow assessments.
- User-Friendly Dashboard: Easily interpretable charts and summaries for clear visualization of your valuation insights.
- Suitable for All Skill Levels: An intuitive design tailored for investors, CFOs, and consultants alike.
How It Works
- Step 1: Download the prebuilt Excel template featuring Chengzhi Shareholding Co., Ltd.'s (000990SZ) data.
- Step 2: Navigate through the pre-filled sheets to familiarize yourself with the key metrics.
- Step 3: Modify forecasts and assumptions in the editable yellow cells (WACC, growth, margins).
- Step 4: Instantly see the recalculated results, including the intrinsic value of Chengzhi Shareholding Co., Ltd. (000990SZ).
- Step 5: Use the outputs to make informed investment decisions or create comprehensive reports.
Why Choose This Calculator for Chengzhi Shareholding Co., Ltd. (000990SZ)?
- User-Friendly and Accessible: Suitable for both newcomers and seasoned analysts.
- Customizable Inputs: Easily adjust parameters to tailor your financial analysis.
- Real-Time Adjustments: Instantly observe changes to Chengzhi's valuation with each input modification.
- Preloaded Data: Comes equipped with Chengzhi’s current financial information for swift evaluations.
- Relied Upon by Experts: Favored by investors and analysts for making strategic decisions.
Who Can Benefit from This Product?
- Individual Investors: Make well-informed choices regarding the purchase or sale of Chengzhi Shareholding Co., Ltd. (000990SZ) stock.
- Financial Analysts: Enhance valuation workflows with our comprehensive financial models tailored for Chengzhi Shareholding Co., Ltd. (000990SZ).
- Consultants: Provide clients with precise and timely valuation insights related to Chengzhi Shareholding Co., Ltd. (000990SZ).
- Business Owners: Gain valuable knowledge on how major companies like Chengzhi Shareholding Co., Ltd. (000990SZ) are appraised to inform your own business strategies.
- Finance Students: Master valuation methods through real-world examples and data pertaining to Chengzhi Shareholding Co., Ltd. (000990SZ).
Contents of the Template
- Historical Data: Comprehensive overview of Chengzhi Shareholding Co., Ltd.'s past financial performance and foundational forecasts.
- DCF and Levered DCF Models: In-depth templates to assess the intrinsic value of Chengzhi Shareholding Co., Ltd. (000990SZ).
- WACC Sheet: Ready-to-use calculations for Weighted Average Cost of Capital.
- Editable Inputs: Customize essential drivers such as growth rates, EBITDA percentages, and CAPEX estimates.
- Quarterly and Annual Statements: Detailed breakdown of Chengzhi Shareholding Co., Ltd.'s financial data.
- Interactive Dashboard: Dynamic visualization of valuation outcomes and projections.
Disclaimer
All information, articles, and product details provided on this website are for general informational and educational purposes only. We do not claim any ownership over, nor do we intend to infringe upon, any trademarks, copyrights, logos, brand names, or other intellectual property mentioned or depicted on this site. Such intellectual property remains the property of its respective owners, and any references here are made solely for identification or informational purposes, without implying any affiliation, endorsement, or partnership.
We make no representations or warranties, express or implied, regarding the accuracy, completeness, or suitability of any content or products presented. Nothing on this website should be construed as legal, tax, investment, financial, medical, or other professional advice. In addition, no part of this site—including articles or product references—constitutes a solicitation, recommendation, endorsement, advertisement, or offer to buy or sell any securities, franchises, or other financial instruments, particularly in jurisdictions where such activity would be unlawful.
All content is of a general nature and may not address the specific circumstances of any individual or entity. It is not a substitute for professional advice or services. Any actions you take based on the information provided here are strictly at your own risk. You accept full responsibility for any decisions or outcomes arising from your use of this website and agree to release us from any liability in connection with your use of, or reliance upon, the content or products found herein.