
|
Hang Seng Bank Limited (0011.HK) Valoración de DCF |
Completamente Editable: Adáptelo A Sus Necesidades En Excel O Sheets
Diseño Profesional: Plantillas Confiables Y Estándares De La Industria
Predeterminadas Para Un Uso Rápido Y Eficiente
Compatible con MAC / PC, completamente desbloqueado
No Se Necesita Experiencia; Fáciles De Seguir
Hang Seng Bank Limited (0011.HK) Bundle
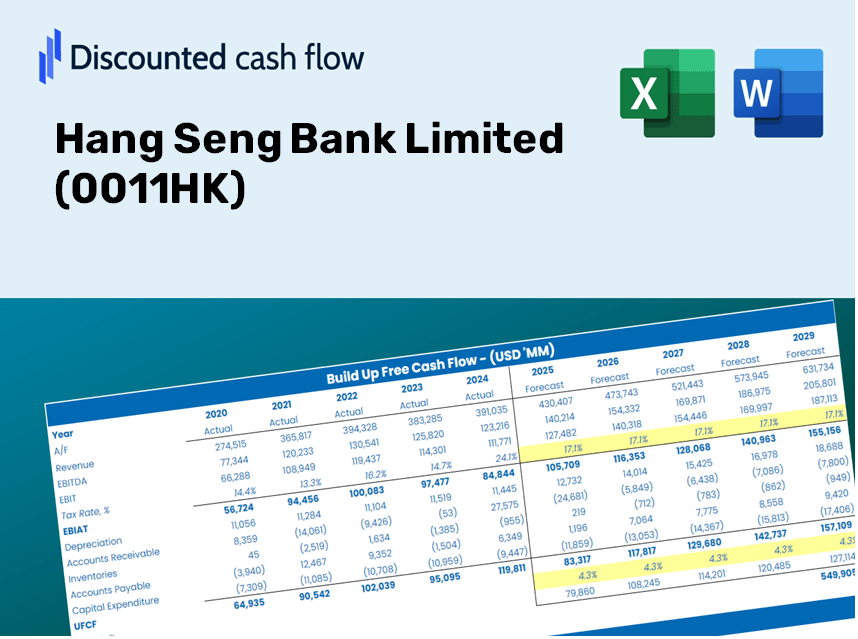
Ingementista para su precisión, nuestra calculadora DCF (0011HK) le permite evaluar la valoración de Hang Seng Bank Limited utilizando datos financieros auténticos y una flexibilidad completa para modificar todos los parámetros clave para las proyecciones mejoradas.
Discounted Cash Flow (DCF) - (USD MM)
| Year | AY1 2020 |
AY2 2021 |
AY3 2022 |
AY4 2023 |
AY5 2024 |
FY1 2025 |
FY2 2026 |
FY3 2027 |
FY4 2028 |
FY5 2029 |
|---|---|---|---|---|---|---|---|---|---|---|
| Revenue | 65,224.0 | 56,848.0 | 26,705.0 | 34,574.0 | 41,572.0 | 39,892.6 | 38,281.1 | 36,734.7 | 35,250.7 | 33,826.7 |
| Revenue Growth, % | 0 | -12.84 | -53.02 | 29.47 | 20.24 | -4.04 | -4.04 | -4.04 | -4.04 | -4.04 |
| EBITDA | .0 | 18,923.0 | 15,467.0 | 22,761.0 | .0 | 12,529.3 | 12,023.1 | 11,537.5 | 11,071.4 | 10,624.1 |
| EBITDA, % | 0 | 33.29 | 57.92 | 65.83 | 0 | 31.41 | 31.41 | 31.41 | 31.41 | 31.41 |
| Depreciation | 2,383.0 | 2,538.0 | 2,676.0 | 2,849.0 | 3,133.0 | 2,705.9 | 2,596.6 | 2,491.7 | 2,391.1 | 2,294.5 |
| Depreciation, % | 3.65 | 4.46 | 10.02 | 8.24 | 7.54 | 6.78 | 6.78 | 6.78 | 6.78 | 6.78 |
| EBIT | -2,383.0 | 16,385.0 | 12,791.0 | 19,912.0 | -3,133.0 | 9,823.4 | 9,426.5 | 9,045.7 | 8,680.3 | 8,329.6 |
| EBIT, % | -3.65 | 28.82 | 47.9 | 57.59 | -7.54 | 24.62 | 24.62 | 24.62 | 24.62 | 24.62 |
| Total Cash | 96,603.0 | 89,148.0 | 92,297.0 | 99,229.0 | 165,601.0 | 39,892.6 | 38,281.1 | 36,734.7 | 35,250.7 | 33,826.7 |
| Total Cash, percent | .0 | .0 | .0 | .0 | .0 | .0 | .0 | .0 | .0 | .0 |
| Account Receivables | .0 | .0 | .0 | .0 | .0 | .0 | .0 | .0 | .0 | .0 |
| Account Receivables, % | 0 | 0 | 0 | 0 | 0 | 0 | 0 | 0 | 0 | 0 |
| Inventories | .0 | .0 | .0 | .0 | .0 | .0 | .0 | .0 | .0 | .0 |
| Inventories, % | 0 | 0 | 0 | 0 | 0 | 0 | 0 | 0 | 0 | 0 |
| Accounts Payable | .0 | .0 | .0 | .0 | .0 | .0 | .0 | .0 | .0 | .0 |
| Accounts Payable, % | 0 | 0 | 0 | 0 | 0 | 0 | 0 | 0 | 0 | 0 |
| Capital Expenditure | -2,110.0 | -2,146.0 | -1,887.0 | -1,750.0 | -1,748.0 | -1,862.4 | -1,787.1 | -1,715.0 | -1,645.7 | -1,579.2 |
| Capital Expenditure, % | -3.24 | -3.77 | -7.07 | -5.06 | -4.2 | -4.67 | -4.67 | -4.67 | -4.67 | -4.67 |
| Tax Rate, % | 12.54 | 12.54 | 12.54 | 12.54 | 12.54 | 12.54 | 12.54 | 12.54 | 12.54 | 12.54 |
| EBITAT | -2,048.3 | 13,960.0 | 11,294.8 | 16,975.5 | -2,740.1 | 8,490.7 | 8,147.7 | 7,818.6 | 7,502.7 | 7,199.6 |
| Depreciation | ||||||||||
| Changes in Account Receivables | ||||||||||
| Changes in Inventories | ||||||||||
| Changes in Accounts Payable | ||||||||||
| Capital Expenditure | ||||||||||
| UFCF | -1,775.3 | 14,352.0 | 12,083.8 | 18,074.5 | -1,355.1 | 9,334.3 | 8,957.2 | 8,595.3 | 8,248.1 | 7,914.9 |
| WACC, % | 14.91 | 14.82 | 15.18 | 14.83 | 15.08 | 14.96 | 14.96 | 14.96 | 14.96 | 14.96 |
| PV UFCF | ||||||||||
| SUM PV UFCF | 29,218.5 | |||||||||
| Long Term Growth Rate, % | 2.00 | |||||||||
| Free cash flow (T + 1) | 8,073 | |||||||||
| Terminal Value | 62,289 | |||||||||
| Present Terminal Value | 31,021 | |||||||||
| Enterprise Value | 60,240 | |||||||||
| Net Debt | -54,511 | |||||||||
| Equity Value | 114,751 | |||||||||
| Diluted Shares Outstanding, MM | 1,896 | |||||||||
| Equity Value Per Share | 60.54 |
Benefits You Will Receive
- Comprehensive Financial Model: Utilizes Hang Seng Bank Limited’s (0011HK) actual data for accurate DCF valuation.
- Complete Forecast Flexibility: Modify key factors such as revenue growth, profit margins, WACC, and more.
- Real-Time Calculations: Automatic updates provide immediate insights as changes are made.
- Professional-Grade Template: A polished Excel sheet crafted for high-quality valuation analysis.
- Adaptable and Reusable: Designed for versatility, making it suitable for repetitive detailed forecasting.
Key Features
- 🔍 Real-Life HSB Financials: Pre-filled historical and projected data for Hang Seng Bank Limited (0011HK).
- ✏️ Fully Customizable Inputs: Modify all essential parameters (yellow cells) such as WACC, growth %, and tax rates.
- 📊 Professional DCF Valuation: Integrated formulas determine Hang Seng Bank’s intrinsic value using the Discounted Cash Flow method.
- ⚡ Instant Results: Visualize the valuation of Hang Seng Bank immediately after adjustments.
- Scenario Analysis: Evaluate and compare various financial assumptions side-by-side.
How It Functions
- Download: Get the pre-prepared Excel file containing Hang Seng Bank Limited's (0011HK) financial data.
- Customize: Modify forecasts such as revenue growth, EBITDA percentage, and WACC.
- Update Automatically: Calculations for intrinsic value and NPV refresh in real-time.
- Test Scenarios: Develop various projections and instantly compare the results.
- Make Decisions: Utilize the valuation insights to inform your investment strategy.
Why Select This Calculator for Hang Seng Bank Limited (0011HK)?
- All-in-One Solution: Features DCF, WACC, and comprehensive financial ratio analyses seamlessly integrated.
- Flexible Inputs: Modify the highlighted cells to explore a variety of financial scenarios.
- In-Depth Analysis: Automatically computes the intrinsic value and Net Present Value for Hang Seng Bank Limited (0011HK).
- Data Ready: Comes with historical and projected data for precise calculations.
- Expert-Level Tool: Perfect for financial analysts, investors, and business consultants focused on Hang Seng Bank Limited (0011HK).
Who Can Benefit from This Product?
- Finance Students: Discover valuation techniques and apply them to real-world data.
- Academics: Integrate professional models into your coursework or research initiatives.
- Investors: Evaluate your assumptions and assess valuation outcomes for Hang Seng Bank Limited (0011HK) stock.
- Analysts: Enhance your efficiency with a pre-built, customizable DCF model.
- Small Business Owners: Learn how major public companies like Hang Seng Bank Limited (0011HK) are analyzed.
Contents of the Template
- Pre-Filled DCF Model: Hang Seng Bank’s financial data preloaded for immediate analysis.
- WACC Calculator: Comprehensive calculations for Weighted Average Cost of Capital.
- Financial Ratios: Assess Hang Seng Bank’s profitability, leverage, and operational efficiency.
- Editable Inputs: Adjust parameters such as growth rates, profit margins, and CAPEX to tailor your models.
- Financial Statements: Access annual and quarterly reports for thorough analysis.
- Interactive Dashboard: Effortlessly visualize essential valuation metrics and outcomes.
Disclaimer
All information, articles, and product details provided on this website are for general informational and educational purposes only. We do not claim any ownership over, nor do we intend to infringe upon, any trademarks, copyrights, logos, brand names, or other intellectual property mentioned or depicted on this site. Such intellectual property remains the property of its respective owners, and any references here are made solely for identification or informational purposes, without implying any affiliation, endorsement, or partnership.
We make no representations or warranties, express or implied, regarding the accuracy, completeness, or suitability of any content or products presented. Nothing on this website should be construed as legal, tax, investment, financial, medical, or other professional advice. In addition, no part of this site—including articles or product references—constitutes a solicitation, recommendation, endorsement, advertisement, or offer to buy or sell any securities, franchises, or other financial instruments, particularly in jurisdictions where such activity would be unlawful.
All content is of a general nature and may not address the specific circumstances of any individual or entity. It is not a substitute for professional advice or services. Any actions you take based on the information provided here are strictly at your own risk. You accept full responsibility for any decisions or outcomes arising from your use of this website and agree to release us from any liability in connection with your use of, or reliance upon, the content or products found herein.