
|
Guangdong Yuehai Feeds Group Co., Ltd. (001313.sz) Valoración de DCF |
Completamente Editable: Adáptelo A Sus Necesidades En Excel O Sheets
Diseño Profesional: Plantillas Confiables Y Estándares De La Industria
Predeterminadas Para Un Uso Rápido Y Eficiente
Compatible con MAC / PC, completamente desbloqueado
No Se Necesita Experiencia; Fáciles De Seguir
Guangdong Yuehai Feeds Group Co.,Ltd. (001313.SZ) Bundle
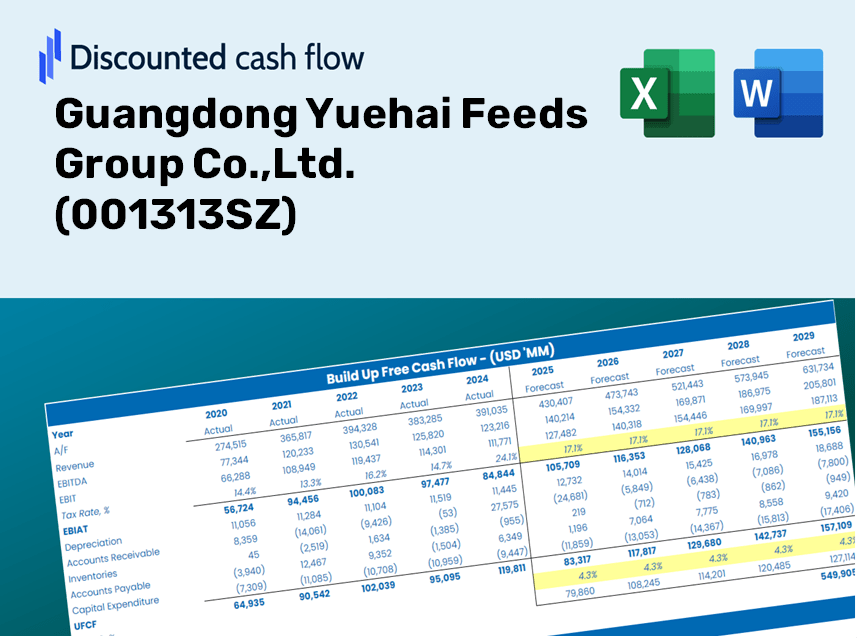
Ya sea que sea un inversor o analista, esta calculadora DCF (001313SZ) DCF es su herramienta final para una valoración precisa. Precedido con Guangdong Yuehai Feeds Group Co., Ltd. Datos reales, puede ajustar los pronósticos y observar instantáneamente el impacto.
What You Will Receive
- Genuine 001313SZ Financials: Contains both historical and projected data for precise valuation.
- Customizable Parameters: Adjust key inputs such as WACC, tax rates, revenue growth, and capital expenditures.
- Real-Time Calculations: Intrinsic value and NPV are computed automatically.
- Scenario Evaluation: Analyze various scenarios to assess Guangdong Yuehai Feeds Group Co., Ltd.'s future performance.
- User-Friendly Interface: Designed for professionals, yet easy to navigate for newcomers.
Key Features
- Genuine Financial Data: Gain access to reliable historical data and future forecasts specifically for Guangdong Yuehai Feeds Group Co., Ltd. (001313SZ).
- Tailorable Forecast Assumptions: Modify highlighted fields like WACC, growth rates, and profit margins to suit your analysis.
- Automatic Calculations: Enjoy real-time updates to DCF, Net Present Value (NPV), and cash flow assessments.
- User-Friendly Dashboard: Intuitive charts and summaries that make it easy to visualize your valuation outcomes.
- Designed for Everyone: An accessible format that caters to investors, CFOs, and consultants—from novices to experts.
How It Works
- Download: Get the ready-to-use Excel file containing Guangdong Yuehai Feeds Group Co., Ltd.'s (001313SZ) financial data.
- Customize: Modify forecasts, such as revenue growth, EBITDA %, and WACC to suit your analysis.
- Update Automatically: Watch as the intrinsic value and NPV calculations refresh in real-time.
- Test Scenarios: Develop various projections and instantly compare their outcomes.
- Make Decisions: Leverage the valuation results to inform your investment strategy for Guangdong Yuehai Feeds Group Co., Ltd. (001313SZ).
Why Opt for This Calculator?
- Designed for Experts: A sophisticated tool utilized by analysts, CFOs, and consultants in the industry.
- Accurate Data: Guangdong Yuehai Feeds Group Co., Ltd.'s (001313SZ) historical and projected financials are preloaded for precision.
- Scenario Simulation: Effortlessly model various forecasts and assumptions.
- Transparent Results: Automatically computes intrinsic value, NPV, and essential metrics.
- User-Friendly: Step-by-step guidance is provided throughout the entire process.
Who Should Use This Product?
- Individual Investors: Gain insights to make informed decisions about trading Guangdong Yuehai Feeds Group Co., Ltd. (001313SZ) stocks.
- Financial Analysts: Enhance the valuation process with comprehensive financial models tailored for Guangdong Yuehai Feeds Group Co., Ltd. (001313SZ).
- Consultants: Provide accurate and timely valuation analysis for clients focusing on Guangdong Yuehai Feeds Group Co., Ltd. (001313SZ).
- Business Owners: Learn how major firms like Guangdong Yuehai Feeds Group Co., Ltd. (001313SZ) establish their market value to inform your own business strategies.
- Finance Students: Develop practical valuation skills through the study of real data and scenarios related to Guangdong Yuehai Feeds Group Co., Ltd. (001313SZ).
Contents of the Template
- Preloaded 001313SZ Data: Historical and projected financial metrics, including revenue, EBIT, and capital expenditures.
- DCF and WACC Models: Advanced sheets designed for calculating intrinsic value and the Weighted Average Cost of Capital.
- Editable Inputs: Cells highlighted in yellow for modifying revenue growth, tax rates, and discount rates.
- Financial Statements: Detailed annual and quarterly financial reports for in-depth analysis.
- Key Ratios: Ratios for profitability, leverage, and efficiency to assess performance.
- Dashboard and Charts: Visual representations of valuation results and underlying assumptions.
Disclaimer
All information, articles, and product details provided on this website are for general informational and educational purposes only. We do not claim any ownership over, nor do we intend to infringe upon, any trademarks, copyrights, logos, brand names, or other intellectual property mentioned or depicted on this site. Such intellectual property remains the property of its respective owners, and any references here are made solely for identification or informational purposes, without implying any affiliation, endorsement, or partnership.
We make no representations or warranties, express or implied, regarding the accuracy, completeness, or suitability of any content or products presented. Nothing on this website should be construed as legal, tax, investment, financial, medical, or other professional advice. In addition, no part of this site—including articles or product references—constitutes a solicitation, recommendation, endorsement, advertisement, or offer to buy or sell any securities, franchises, or other financial instruments, particularly in jurisdictions where such activity would be unlawful.
All content is of a general nature and may not address the specific circumstances of any individual or entity. It is not a substitute for professional advice or services. Any actions you take based on the information provided here are strictly at your own risk. You accept full responsibility for any decisions or outcomes arising from your use of this website and agree to release us from any liability in connection with your use of, or reliance upon, the content or products found herein.