
|
Zhejiang Weixing Industrial Development Co., Ltd. (002003.sz) Valoración de DCF |
Completamente Editable: Adáptelo A Sus Necesidades En Excel O Sheets
Diseño Profesional: Plantillas Confiables Y Estándares De La Industria
Predeterminadas Para Un Uso Rápido Y Eficiente
Compatible con MAC / PC, completamente desbloqueado
No Se Necesita Experiencia; Fáciles De Seguir
Zhejiang Weixing Industrial Development Co., Ltd. (002003.SZ) Bundle
Ingementada para su precisión, nuestra calculadora DCF (002003SZ) le permite evaluar Zhejiang Weixing Industrial Development Co., Ltd. Valoración utilizando datos financieros actualizados y flexibilidad completa para modificar todos los parámetros esenciales para las proyecciones mejoradas.
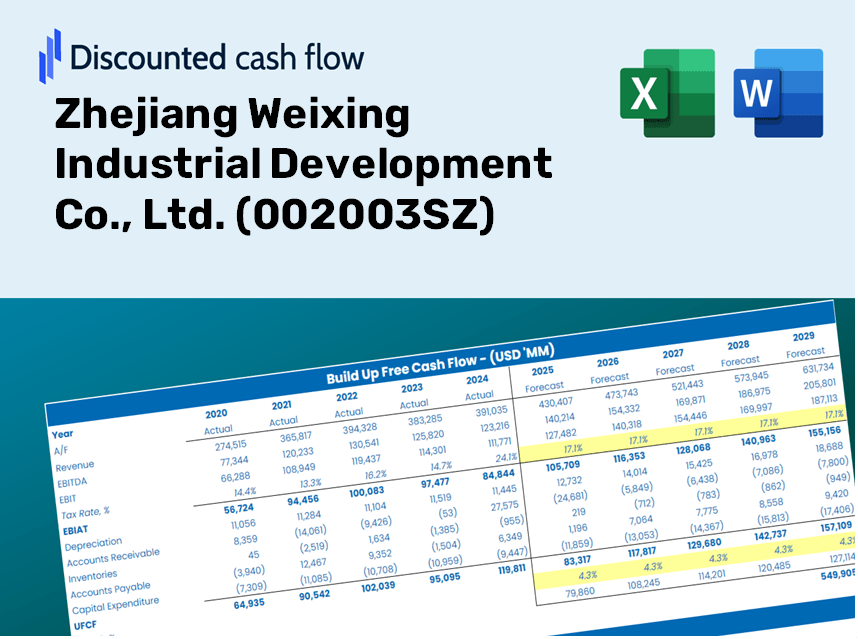
Discounted Cash Flow (DCF) - (USD MM)
| Year | AY1 2020 |
AY2 2021 |
AY3 2022 |
AY4 2023 |
AY5 2024 |
FY1 2025 |
FY2 2026 |
FY3 2027 |
FY4 2028 |
FY5 2029 |
|---|---|---|---|---|---|---|---|---|---|---|
| Revenue | 2,496.1 | 3,355.7 | 3,628.1 | 3,906.5 | 4,674.4 | 5,491.1 | 6,450.5 | 7,577.5 | 8,901.3 | 10,456.5 |
| Revenue Growth, % | 0 | 34.44 | 8.12 | 7.67 | 19.66 | 17.47 | 17.47 | 17.47 | 17.47 | 17.47 |
| EBITDA | 657.6 | 729.3 | 833.1 | 946.1 | 1,168.1 | 1,320.6 | 1,551.3 | 1,822.3 | 2,140.7 | 2,514.7 |
| EBITDA, % | 26.34 | 21.73 | 22.96 | 24.22 | 24.99 | 24.05 | 24.05 | 24.05 | 24.05 | 24.05 |
| Depreciation | 179.0 | 201.6 | 237.0 | 254.1 | 288.6 | 355.7 | 417.9 | 490.9 | 576.6 | 677.4 |
| Depreciation, % | 7.17 | 6.01 | 6.53 | 6.5 | 6.17 | 6.48 | 6.48 | 6.48 | 6.48 | 6.48 |
| EBIT | 478.5 | 527.7 | 596.1 | 692.0 | 879.5 | 964.9 | 1,133.4 | 1,331.5 | 1,564.1 | 1,837.3 |
| EBIT, % | 19.17 | 15.73 | 16.43 | 17.71 | 18.81 | 17.57 | 17.57 | 17.57 | 17.57 | 17.57 |
| Total Cash | 672.9 | 633.8 | 821.3 | 1,415.1 | 1,107.9 | 1,410.2 | 1,656.6 | 1,946.0 | 2,286.0 | 2,685.4 |
| Total Cash, percent | .0 | .0 | .0 | .0 | .0 | .0 | .0 | .0 | .0 | .0 |
| Account Receivables | 432.9 | 480.6 | 426.3 | 664.6 | 710.8 | 830.6 | 975.7 | 1,146.2 | 1,346.4 | 1,581.7 |
| Account Receivables, % | 17.34 | 14.32 | 11.75 | 17.01 | 15.21 | 15.13 | 15.13 | 15.13 | 15.13 | 15.13 |
| Inventories | 339.5 | 549.8 | 563.4 | 604.5 | 703.9 | 835.2 | 981.1 | 1,152.5 | 1,353.9 | 1,590.4 |
| Inventories, % | 13.6 | 16.39 | 15.53 | 15.47 | 15.06 | 15.21 | 15.21 | 15.21 | 15.21 | 15.21 |
| Accounts Payable | 236.7 | 363.6 | 359.3 | 469.6 | 515.6 | 585.0 | 687.3 | 807.3 | 948.4 | 1,114.1 |
| Accounts Payable, % | 9.48 | 10.84 | 9.9 | 12.02 | 11.03 | 10.65 | 10.65 | 10.65 | 10.65 | 10.65 |
| Capital Expenditure | -328.8 | -449.7 | -734.2 | -671.2 | -765.8 | -882.7 | -1,036.9 | -1,218.1 | -1,430.9 | -1,680.9 |
| Capital Expenditure, % | -13.17 | -13.4 | -20.24 | -17.18 | -16.38 | -16.07 | -16.07 | -16.07 | -16.07 | -16.07 |
| Tax Rate, % | 17.31 | 17.31 | 17.31 | 17.31 | 17.31 | 17.31 | 17.31 | 17.31 | 17.31 | 17.31 |
| EBITAT | 413.5 | 459.0 | 502.3 | 579.7 | 727.2 | 818.4 | 961.4 | 1,129.4 | 1,326.7 | 1,558.4 |
| Depreciation | ||||||||||
| Changes in Account Receivables | ||||||||||
| Changes in Inventories | ||||||||||
| Changes in Accounts Payable | ||||||||||
| Capital Expenditure | ||||||||||
| UFCF | -272.0 | 79.8 | 41.6 | -6.6 | 150.5 | 109.7 | 153.5 | 180.3 | 211.8 | 248.9 |
| WACC, % | 4.68 | 4.68 | 4.68 | 4.67 | 4.67 | 4.68 | 4.68 | 4.68 | 4.68 | 4.68 |
| PV UFCF | ||||||||||
| SUM PV UFCF | 776.6 | |||||||||
| Long Term Growth Rate, % | 2.00 | |||||||||
| Free cash flow (T + 1) | 254 | |||||||||
| Terminal Value | 9,479 | |||||||||
| Present Terminal Value | 7,542 | |||||||||
| Enterprise Value | 8,319 | |||||||||
| Net Debt | -382 | |||||||||
| Equity Value | 8,701 | |||||||||
| Diluted Shares Outstanding, MM | 1,169 | |||||||||
| Equity Value Per Share | 7.44 |
What You Will Receive
- Genuine Zhejiang Weixing Data: Comprehensive financial metrics – from revenue to EBIT – derived from actual and projected figures.
- Complete Customization: Modify all essential parameters (yellow cells) such as WACC, growth %, and tax rates.
- Instant Valuation Adjustments: Automatic updates to evaluate the effects of changes on Zhejiang Weixing’s fair value.
- Dynamic Excel Template: Designed for easy modifications, scenario analysis, and in-depth forecasts.
- Efficient and Reliable: Eliminate the need to construct models from the ground up while ensuring accuracy and adaptability.
Core Features
- Comprehensive DCF Calculator: Offers detailed unlevered and levered DCF valuation models tailored for Zhejiang Weixing Industrial Development Co., Ltd. (002003SZ).
- WACC Calculator: Features a pre-configured Weighted Average Cost of Capital sheet with adjustable inputs for better accuracy.
- Customizable Forecast Assumptions: Adjust growth rates, capital expenditures, and discount rates to fit specific scenarios.
- Integrated Financial Ratios: Evaluate profitability, leverage, and efficiency ratios specific to Zhejiang Weixing Industrial Development Co., Ltd. (002003SZ).
- Visualization Dashboard and Charts: Offers visual representations that summarize crucial valuation metrics for straightforward analysis.
How It Functions
- Step 1: Download the ready-to-use Excel template that includes data for Zhejiang Weixing Industrial Development Co., Ltd. (002003SZ).
- Step 2: Review the pre-populated sheets to familiarize yourself with the essential metrics.
- Step 3: Modify forecasts and assumptions in the editable yellow cells (WACC, growth, margins) as needed.
- Step 4: Instantly access the updated results, including the intrinsic value of Zhejiang Weixing Industrial Development Co., Ltd. (002003SZ).
- Step 5: Utilize the outputs to make well-informed investment decisions or create detailed reports.
Why Choose Zhejiang Weixing Industrial Development Co., Ltd. (002003SZ)?
- Save Time: Skip the hassle of building a financial model from the ground up – our solutions are readily available.
- Enhance Accuracy: Our dependable financial data and calculations minimize valuation errors.
- Completely Customizable: Adapt the model to align with your unique assumptions and forecasts.
- User-Friendly: Intuitive charts and outputs simplify result interpretation.
- Endorsed by Professionals: Crafted for industry experts who prioritize precision and functionality.
Who Can Benefit from This Product?
- Investors: Evaluate the fair value of Zhejiang Weixing Industrial Development Co., Ltd. (002003SZ) to inform your investment choices.
- CFOs: Utilize a high-quality DCF model for comprehensive financial analysis and reporting.
- Consultants: Quickly customize the template for client valuation reports.
- Entrepreneurs: Learn financial modeling techniques employed by leading companies.
- Educators: Employ this resource as a teaching aid to illustrate valuation concepts and methods.
Contents of the Template
- In-Depth DCF Model: Editable template featuring comprehensive valuation calculations.
- Actual Financial Data: Historical and projected financials for Zhejiang Weixing Industrial Development Co., Ltd. (002003SZ) preloaded to facilitate analysis.
- Configurable Assumptions: Modify WACC, growth rates, and tax parameters to explore various scenarios.
- Detailed Financial Statements: Complete annual and quarterly reports for enhanced insights.
- Essential Ratios: Integrated analysis for assessing profitability, operational efficiency, and financial leverage.
- Interactive Dashboard with Visual Insights: Visualizations and tables presenting clear, actionable results.
Disclaimer
All information, articles, and product details provided on this website are for general informational and educational purposes only. We do not claim any ownership over, nor do we intend to infringe upon, any trademarks, copyrights, logos, brand names, or other intellectual property mentioned or depicted on this site. Such intellectual property remains the property of its respective owners, and any references here are made solely for identification or informational purposes, without implying any affiliation, endorsement, or partnership.
We make no representations or warranties, express or implied, regarding the accuracy, completeness, or suitability of any content or products presented. Nothing on this website should be construed as legal, tax, investment, financial, medical, or other professional advice. In addition, no part of this site—including articles or product references—constitutes a solicitation, recommendation, endorsement, advertisement, or offer to buy or sell any securities, franchises, or other financial instruments, particularly in jurisdictions where such activity would be unlawful.
All content is of a general nature and may not address the specific circumstances of any individual or entity. It is not a substitute for professional advice or services. Any actions you take based on the information provided here are strictly at your own risk. You accept full responsibility for any decisions or outcomes arising from your use of this website and agree to release us from any liability in connection with your use of, or reliance upon, the content or products found herein.