
|
Beijing SL Pharmaceutical Co., Ltd. (002038.sz) Valoración de DCF |
Completamente Editable: Adáptelo A Sus Necesidades En Excel O Sheets
Diseño Profesional: Plantillas Confiables Y Estándares De La Industria
Predeterminadas Para Un Uso Rápido Y Eficiente
Compatible con MAC / PC, completamente desbloqueado
No Se Necesita Experiencia; Fáciles De Seguir
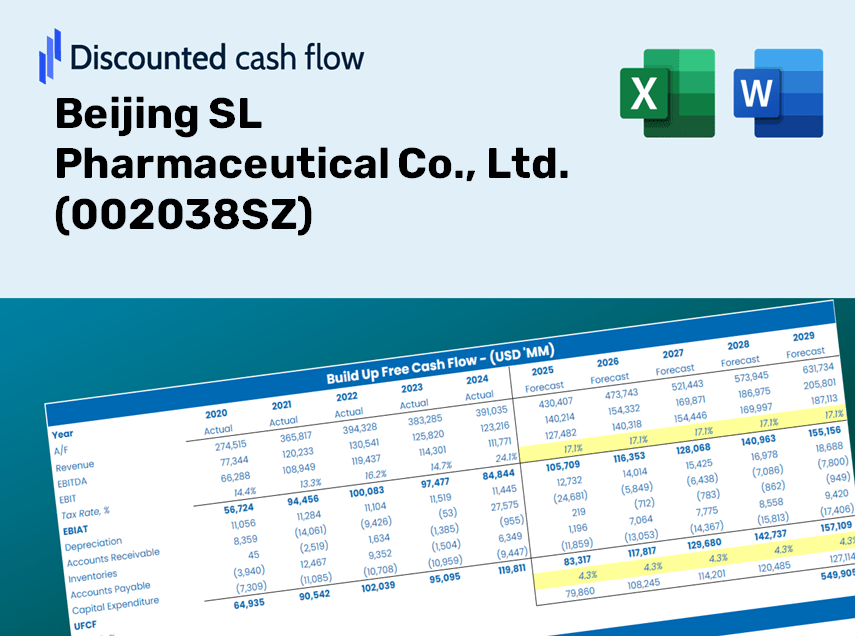
Beijing SL Pharmaceutical Co., Ltd. (002038.SZ) Bundle
¡Evalúe Beijing SL Pharmaceutical Co., Ltd.'s (002038SZ) Outlook financiero como un experto! Esta calculadora DCF (002038SZ) viene con datos financieros previamente llenos y ofrece flexibilidad total para modificar el crecimiento de los ingresos, WACC, los márgenes y otros supuestos esenciales para alinearse con sus proyecciones.
Discounted Cash Flow (DCF) - (USD MM)
| Year | AY1 2020 |
AY2 2021 |
AY3 2022 |
AY4 2023 |
AY5 2024 |
FY1 2025 |
FY2 2026 |
FY3 2027 |
FY4 2028 |
FY5 2029 |
|---|---|---|---|---|---|---|---|---|---|---|
| Revenue | 1,112.7 | 1,214.8 | 1,050.2 | 1,018.4 | 660.4 | 590.2 | 527.4 | 471.3 | 421.1 | 376.3 |
| Revenue Growth, % | 0 | 9.17 | -13.55 | -3.03 | -35.15 | -10.64 | -10.64 | -10.64 | -10.64 | -10.64 |
| EBITDA | 239.4 | 312.0 | 257.2 | 365.5 | 180.6 | 159.2 | 142.3 | 127.2 | 113.6 | 101.5 |
| EBITDA, % | 21.52 | 25.68 | 24.49 | 35.89 | 27.34 | 26.98 | 26.98 | 26.98 | 26.98 | 26.98 |
| Depreciation | 89.5 | 99.7 | 113.5 | 145.4 | 152.9 | 76.1 | 68.0 | 60.8 | 54.3 | 48.5 |
| Depreciation, % | 8.04 | 8.2 | 10.81 | 14.28 | 23.16 | 12.9 | 12.9 | 12.9 | 12.9 | 12.9 |
| EBIT | 149.9 | 212.3 | 143.7 | 220.1 | 27.6 | 83.1 | 74.3 | 66.4 | 59.3 | 53.0 |
| EBIT, % | 13.48 | 17.48 | 13.68 | 21.61 | 4.19 | 14.09 | 14.09 | 14.09 | 14.09 | 14.09 |
| Total Cash | 1,442.9 | 1,636.4 | 1,453.3 | 2,133.0 | 892.8 | 590.2 | 527.4 | 471.3 | 421.1 | 376.3 |
| Total Cash, percent | .0 | .0 | .0 | .0 | .0 | .0 | .0 | .0 | .0 | .0 |
| Account Receivables | 470.2 | 381.4 | 286.3 | 235.8 | 121.4 | 168.2 | 150.3 | 134.3 | 120.0 | 107.2 |
| Account Receivables, % | 42.26 | 31.4 | 27.27 | 23.16 | 18.39 | 28.49 | 28.49 | 28.49 | 28.49 | 28.49 |
| Inventories | 112.0 | 124.8 | 136.8 | 144.5 | 246.3 | 100.2 | 89.5 | 80.0 | 71.5 | 63.9 |
| Inventories, % | 10.07 | 10.28 | 13.03 | 14.19 | 37.3 | 16.97 | 16.97 | 16.97 | 16.97 | 16.97 |
| Accounts Payable | 179.9 | 191.4 | 176.2 | 250.8 | 27.2 | 91.4 | 81.7 | 73.0 | 65.2 | 58.3 |
| Accounts Payable, % | 16.17 | 15.76 | 16.78 | 24.62 | 4.11 | 15.49 | 15.49 | 15.49 | 15.49 | 15.49 |
| Capital Expenditure | -255.9 | -236.9 | -163.5 | -218.4 | -347.4 | -155.9 | -139.3 | -124.5 | -111.3 | -99.4 |
| Capital Expenditure, % | -23 | -19.5 | -15.57 | -21.44 | -52.6 | -26.42 | -26.42 | -26.42 | -26.42 | -26.42 |
| Tax Rate, % | 44.62 | 44.62 | 44.62 | 44.62 | 44.62 | 44.62 | 44.62 | 44.62 | 44.62 | 44.62 |
| EBITAT | 132.5 | 197.5 | 129.8 | 197.3 | 15.3 | 69.3 | 61.9 | 55.3 | 49.4 | 44.2 |
| Depreciation | ||||||||||
| Changes in Account Receivables | ||||||||||
| Changes in Inventories | ||||||||||
| Changes in Accounts Payable | ||||||||||
| Capital Expenditure | ||||||||||
| UFCF | -436.3 | 147.7 | 147.7 | 241.8 | -390.2 | 153.2 | 9.4 | 8.4 | 7.5 | 6.7 |
| WACC, % | 5 | 5 | 5 | 5 | 5 | 5 | 5 | 5 | 5 | 5 |
| PV UFCF | ||||||||||
| SUM PV UFCF | 173.1 | |||||||||
| Long Term Growth Rate, % | 4.00 | |||||||||
| Free cash flow (T + 1) | 7 | |||||||||
| Terminal Value | 699 | |||||||||
| Present Terminal Value | 548 | |||||||||
| Enterprise Value | 721 | |||||||||
| Net Debt | -412 | |||||||||
| Equity Value | 1,133 | |||||||||
| Diluted Shares Outstanding, MM | 1,058 | |||||||||
| Equity Value Per Share | 1.07 |
What You Will Receive
- Authentic 002038SZ Financial Data: Pre-loaded with Beijing SL Pharmaceutical's historical and forecasted data for accurate analysis.
- Completely Customizable Template: Effortlessly adjust key metrics such as revenue growth, WACC, and EBITDA %.
- Instant Calculations: Observe real-time updates of Beijing SL Pharmaceutical's intrinsic value based on your modifications.
- Advanced Valuation Tool: Tailored for investors, analysts, and consultants aiming for precise DCF outcomes.
- Intuitive Design: Organized format and straightforward guidelines suitable for all skill levels.
Key Features
- Comprehensive Historical Data: Access Beijing SL Pharmaceutical Co., Ltd.'s historical financial reports and pre-populated forecasts.
- Customizable Parameters: Tailor WACC, tax rates, revenue growth projections, and EBITDA margins to your needs.
- Real-Time Valuation: Instantly observe the recalculated intrinsic value of Beijing SL Pharmaceutical Co., Ltd. (002038SZ).
- Intuitive Visualizations: Engaging dashboard charts showcase valuation results and important metrics.
- Designed for Precision: A professional-grade tool crafted for analysts, investors, and finance professionals.
How It Works
- Download: Obtain the ready-to-use Excel file featuring financial data for Beijing SL Pharmaceutical Co., Ltd. (002038SZ).
- Customize: Modify forecasts, including revenue growth, EBITDA %, and WACC to suit your analysis.
- Update Automatically: Watch as intrinsic value and NPV calculations refresh in real-time.
- Test Scenarios: Develop various projections and instantly compare the results.
- Make Decisions: Leverage the valuation insights to inform your investment strategy.
Why Choose This Calculator for Beijing SL Pharmaceutical Co., Ltd. (002038SZ)?
- Designed for Experts: A sophisticated tool favored by analysts, CFOs, and industry consultants.
- Accurate Data: Historical and projected financials of Beijing SL Pharmaceutical preloaded for precision.
- Flexible Scenario Analysis: Effortlessly test various forecasts and assumptions.
- Concise Outputs: Automatically computes intrinsic value, NPV, and other critical metrics.
- User-Friendly: Comprehensive step-by-step guidance simplifies the process.
Who Can Benefit from This Product?
- Investors: Accurately assess the fair value of Beijing SL Pharmaceutical Co., Ltd. (002038SZ) before making investment choices.
- CFOs: Utilize a professional-grade DCF model for enhanced financial reporting and analysis.
- Consultants: Efficiently customize the template for valuation reports tailored to client needs.
- Entrepreneurs: Discover valuable insights into financial modeling practices employed by major pharmaceutical companies.
- Educators: Implement this resource as a teaching aid to illustrate valuation techniques.
Contents of the Template
- Pre-Filled Data: Includes Beijing SL Pharmaceutical Co., Ltd.’s historical financials and projections.
- Discounted Cash Flow Model: An editable DCF valuation model featuring automatic calculations.
- Weighted Average Cost of Capital (WACC): A dedicated sheet for computing WACC using custom inputs.
- Key Financial Ratios: Evaluate Beijing SL Pharmaceutical Co., Ltd.’s profitability, efficiency, and leverage.
- Customizable Inputs: Easily modify revenue growth, margins, and tax rates.
- Clear Dashboard: Visual representations and tables summarizing essential valuation outcomes.
Disclaimer
All information, articles, and product details provided on this website are for general informational and educational purposes only. We do not claim any ownership over, nor do we intend to infringe upon, any trademarks, copyrights, logos, brand names, or other intellectual property mentioned or depicted on this site. Such intellectual property remains the property of its respective owners, and any references here are made solely for identification or informational purposes, without implying any affiliation, endorsement, or partnership.
We make no representations or warranties, express or implied, regarding the accuracy, completeness, or suitability of any content or products presented. Nothing on this website should be construed as legal, tax, investment, financial, medical, or other professional advice. In addition, no part of this site—including articles or product references—constitutes a solicitation, recommendation, endorsement, advertisement, or offer to buy or sell any securities, franchises, or other financial instruments, particularly in jurisdictions where such activity would be unlawful.
All content is of a general nature and may not address the specific circumstances of any individual or entity. It is not a substitute for professional advice or services. Any actions you take based on the information provided here are strictly at your own risk. You accept full responsibility for any decisions or outcomes arising from your use of this website and agree to release us from any liability in connection with your use of, or reliance upon, the content or products found herein.