
|
Sinomach Precision Industry Co., Ltd. (002046.sz) Valoración de DCF |
Completamente Editable: Adáptelo A Sus Necesidades En Excel O Sheets
Diseño Profesional: Plantillas Confiables Y Estándares De La Industria
Predeterminadas Para Un Uso Rápido Y Eficiente
Compatible con MAC / PC, completamente desbloqueado
No Se Necesita Experiencia; Fáciles De Seguir
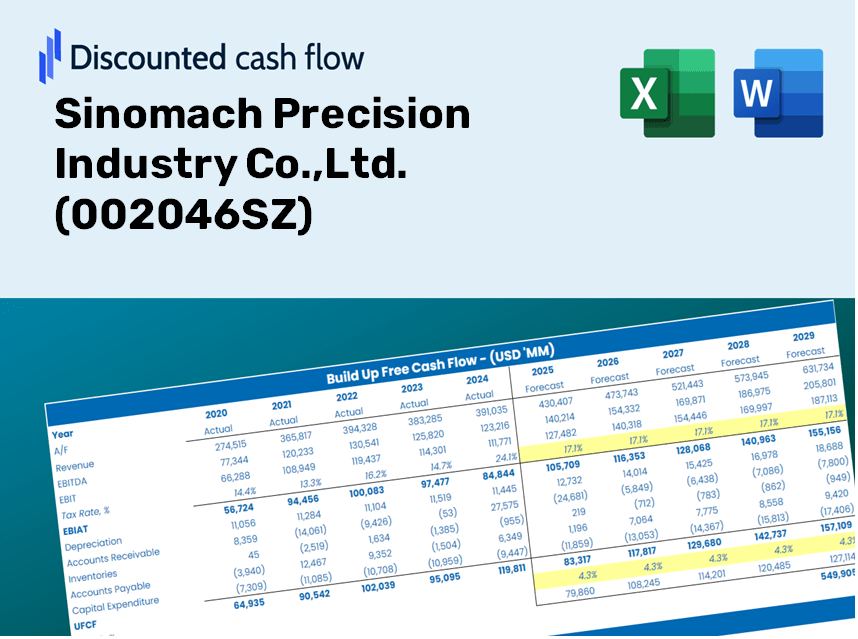
Sinomach Precision Industry Co.,Ltd. (002046.SZ) Bundle
¡Simplifique Sinomach Precision Industry Co., Ltd. Valoración con esta calculadora DCF personalizable! Con Real Sinomach Precision Industry Co., Ltd. Financials y aportes de pronóstico ajustables, puede probar escenarios y descubrir Sinomach Precision Industry Co., Ltd. Valor razonable en minutos.
Discounted Cash Flow (DCF) - (USD MM)
| Year | AY1 2020 |
AY2 2021 |
AY3 2022 |
AY4 2023 |
AY5 2024 |
FY1 2025 |
FY2 2026 |
FY3 2027 |
FY4 2028 |
FY5 2029 |
|---|---|---|---|---|---|---|---|---|---|---|
| Revenue | 2,355.1 | 3,327.9 | 3,436.0 | 2,783.7 | 2,657.6 | 2,797.3 | 2,944.5 | 3,099.3 | 3,262.3 | 3,433.9 |
| Revenue Growth, % | 0 | 41.3 | 3.25 | -18.98 | -4.53 | 5.26 | 5.26 | 5.26 | 5.26 | 5.26 |
| EBITDA | 220.7 | 246.0 | 351.5 | 361.3 | 390.0 | 305.7 | 321.8 | 338.7 | 356.5 | 375.3 |
| EBITDA, % | 9.37 | 7.39 | 10.23 | 12.98 | 14.68 | 10.93 | 10.93 | 10.93 | 10.93 | 10.93 |
| Depreciation | 111.6 | 126.7 | 149.1 | 149.3 | 157.6 | 135.3 | 142.4 | 149.9 | 157.7 | 166.0 |
| Depreciation, % | 4.74 | 3.81 | 4.34 | 5.36 | 5.93 | 4.84 | 4.84 | 4.84 | 4.84 | 4.84 |
| EBIT | 109.1 | 119.3 | 202.4 | 212.0 | 232.4 | 170.5 | 179.4 | 188.9 | 198.8 | 209.3 |
| EBIT, % | 4.63 | 3.58 | 5.89 | 7.62 | 8.75 | 6.09 | 6.09 | 6.09 | 6.09 | 6.09 |
| Total Cash | 831.4 | 727.8 | 746.8 | 830.7 | 1,158.3 | 852.3 | 897.1 | 944.3 | 993.9 | 1,046.2 |
| Total Cash, percent | .0 | .0 | .0 | .0 | .0 | .0 | .0 | .0 | .0 | .0 |
| Account Receivables | 963.3 | 1,058.1 | 1,130.2 | 1,031.0 | 1,469.3 | 1,107.3 | 1,165.5 | 1,226.8 | 1,291.3 | 1,359.2 |
| Account Receivables, % | 40.9 | 31.79 | 32.89 | 37.04 | 55.29 | 39.58 | 39.58 | 39.58 | 39.58 | 39.58 |
| Inventories | 495.4 | 530.0 | 561.0 | 525.3 | 582.4 | 526.3 | 554.0 | 583.1 | 613.8 | 646.1 |
| Inventories, % | 21.03 | 15.93 | 16.33 | 18.87 | 21.91 | 18.81 | 18.81 | 18.81 | 18.81 | 18.81 |
| Accounts Payable | 504.1 | 529.5 | 654.6 | 652.9 | 728.4 | 599.9 | 631.4 | 664.7 | 699.6 | 736.4 |
| Accounts Payable, % | 21.4 | 15.91 | 19.05 | 23.45 | 27.41 | 21.45 | 21.45 | 21.45 | 21.45 | 21.45 |
| Capital Expenditure | -144.1 | -217.9 | -224.5 | -213.1 | -391.8 | -232.7 | -245.0 | -257.8 | -271.4 | -285.7 |
| Capital Expenditure, % | -6.12 | -6.55 | -6.53 | -7.66 | -14.74 | -8.32 | -8.32 | -8.32 | -8.32 | -8.32 |
| Tax Rate, % | 15.97 | 15.97 | 15.97 | 15.97 | 15.97 | 15.97 | 15.97 | 15.97 | 15.97 | 15.97 |
| EBITAT | 61.0 | 95.4 | 185.8 | 179.6 | 195.3 | 135.2 | 142.3 | 149.7 | 157.6 | 165.9 |
| Depreciation | ||||||||||
| Changes in Account Receivables | ||||||||||
| Changes in Inventories | ||||||||||
| Changes in Accounts Payable | ||||||||||
| Capital Expenditure | ||||||||||
| UFCF | -926.1 | -99.7 | 132.2 | 249.0 | -458.6 | 327.2 | -14.7 | -15.5 | -16.3 | -17.1 |
| WACC, % | 5.82 | 5.85 | 5.87 | 5.86 | 5.86 | 5.85 | 5.85 | 5.85 | 5.85 | 5.85 |
| PV UFCF | ||||||||||
| SUM PV UFCF | 257.1 | |||||||||
| Long Term Growth Rate, % | 3.50 | |||||||||
| Free cash flow (T + 1) | -18 | |||||||||
| Terminal Value | -754 | |||||||||
| Present Terminal Value | -567 | |||||||||
| Enterprise Value | -310 | |||||||||
| Net Debt | -407 | |||||||||
| Equity Value | 97 | |||||||||
| Diluted Shares Outstanding, MM | 526 | |||||||||
| Equity Value Per Share | 0.18 |
Benefits of Choosing Sinomach Precision Industry Co., Ltd. (002046SZ)
- Customizable Excel Template: An interactive Excel-based DCF Calculator pre-loaded with the latest financials for Sinomach Precision Industry.
- Up-to-Date Data: Access historical performance metrics and future projections (highlighted in the yellow cells).
- Forecasting Flexibility: Adjust key variables such as revenue growth, EBITDA margin, and WACC to suit your analysis.
- Instant Calculations: View real-time updates on Sinomach's valuation based on your input changes.
- Professional Resource: Tailored for investors, CFOs, consultants, and financial analysts alike.
- Intuitive Layout: Designed for easy navigation and comprehension, complete with step-by-step guidance.
Key Features
- Comprehensive Historical Data: Access Sinomach Precision Industry Co., Ltd.'s (002046SZ) extensive historical financial records and automated forecasts.
- Customizable Parameters: Adjust inputs like WACC, tax rates, revenue growth, and EBITDA margins to match your analysis needs.
- Immediate Valuation: Observe real-time recalculation of Sinomach Precision Industry Co., Ltd.'s (002046SZ) intrinsic value.
- User-Friendly Visuals: Dashboard graphs present valuation outputs and essential metrics clearly.
- Designed for Precision: A professional-grade tool tailored for analysts, investors, and finance professionals.
How It Functions
- Step 1: Download the Excel spreadsheet.
- Step 2: Examine Sinomach Precision Industry Co., Ltd.'s pre-populated financial metrics and forecasts.
- Step 3: Adjust key inputs such as revenue growth, WACC, and tax rates (marked cells).
- Step 4: Observe the DCF model update in real-time as you change the assumptions.
- Step 5: Evaluate the outputs and leverage the findings for your investment strategy.
Why Choose This Calculator for Sinomach Precision Industry Co., Ltd. (002046SZ)?
- Designed for Industry Experts: A sophisticated tool tailored for analysts, CFOs, and consultants.
- Accurate Financial Data: Sinomach's historical and projected financials are preloaded to ensure precision.
- Flexible Scenario Analysis: Effortlessly test various forecasts and assumptions.
- Comprehensive Outputs: Automatically computes intrinsic value, NPV, and other essential metrics.
- User-Friendly Interface: Step-by-step instructions to assist you throughout the calculation process.
Who Can Benefit from Sinomach Precision Industry Co., Ltd. (002046SZ)?
- Investors: Make informed investment choices with our comprehensive market analysis tools.
- Financial Analysts: Enhance efficiency with our customizable financial models tailored for industrial sectors.
- Consultants: Streamline client engagements by quickly adapting our resources for presentations or reports.
- Industry Enthusiasts: Gain insights into precision manufacturing through practical, real-world applications.
- Educators and Students: Utilize our materials as a hands-on learning resource in engineering and finance programs.
Contents of the Template
- Pre-Filled DCF Model: Sinomach Precision Industry Co., Ltd.'s financial data preloaded for immediate utilization.
- WACC Calculator: Comprehensive calculations for the Weighted Average Cost of Capital.
- Financial Ratios: Assess Sinomach's profitability, leverage, and operational efficiency.
- Editable Inputs: Modify assumptions such as growth rates, profit margins, and capital expenditures to suit your analysis.
- Financial Statements: Annual and quarterly reports available for thorough examination.
- Interactive Dashboard: Effortlessly visualize key valuation metrics and outcomes.
Disclaimer
All information, articles, and product details provided on this website are for general informational and educational purposes only. We do not claim any ownership over, nor do we intend to infringe upon, any trademarks, copyrights, logos, brand names, or other intellectual property mentioned or depicted on this site. Such intellectual property remains the property of its respective owners, and any references here are made solely for identification or informational purposes, without implying any affiliation, endorsement, or partnership.
We make no representations or warranties, express or implied, regarding the accuracy, completeness, or suitability of any content or products presented. Nothing on this website should be construed as legal, tax, investment, financial, medical, or other professional advice. In addition, no part of this site—including articles or product references—constitutes a solicitation, recommendation, endorsement, advertisement, or offer to buy or sell any securities, franchises, or other financial instruments, particularly in jurisdictions where such activity would be unlawful.
All content is of a general nature and may not address the specific circumstances of any individual or entity. It is not a substitute for professional advice or services. Any actions you take based on the information provided here are strictly at your own risk. You accept full responsibility for any decisions or outcomes arising from your use of this website and agree to release us from any liability in connection with your use of, or reliance upon, the content or products found herein.