
|
Suzhou Gold Mantis Construction Decoration Co., Ltd. (002081.SZ): BCG Matrix [Apr-2026 Updated] |
Completamente Editable: Adáptelo A Sus Necesidades En Excel O Sheets
Diseño Profesional: Plantillas Confiables Y Estándares De La Industria
Predeterminadas Para Un Uso Rápido Y Eficiente
Compatible con MAC / PC, completamente desbloqueado
No Se Necesita Experiencia; Fáciles De Seguir
Suzhou Gold Mantis Construction Decoration Co., Ltd. (002081.SZ) Bundle
Gold Mantis's portfolio is anchored by high-share, high-growth public building projects and integrated EPC services that should drive future scaling, funded by cash-generating architectural decoration and in-house furniture manufacturing; meanwhile, strategic capital must flow into prefabrication and smart-home initiatives to capture emerging high-margin opportunities, while the firm urgently retools or trims underperforming international operations and mass-market residential work to stop cash leakage-read on to see where management should allocate investment and which units warrant defense, build, or divest.
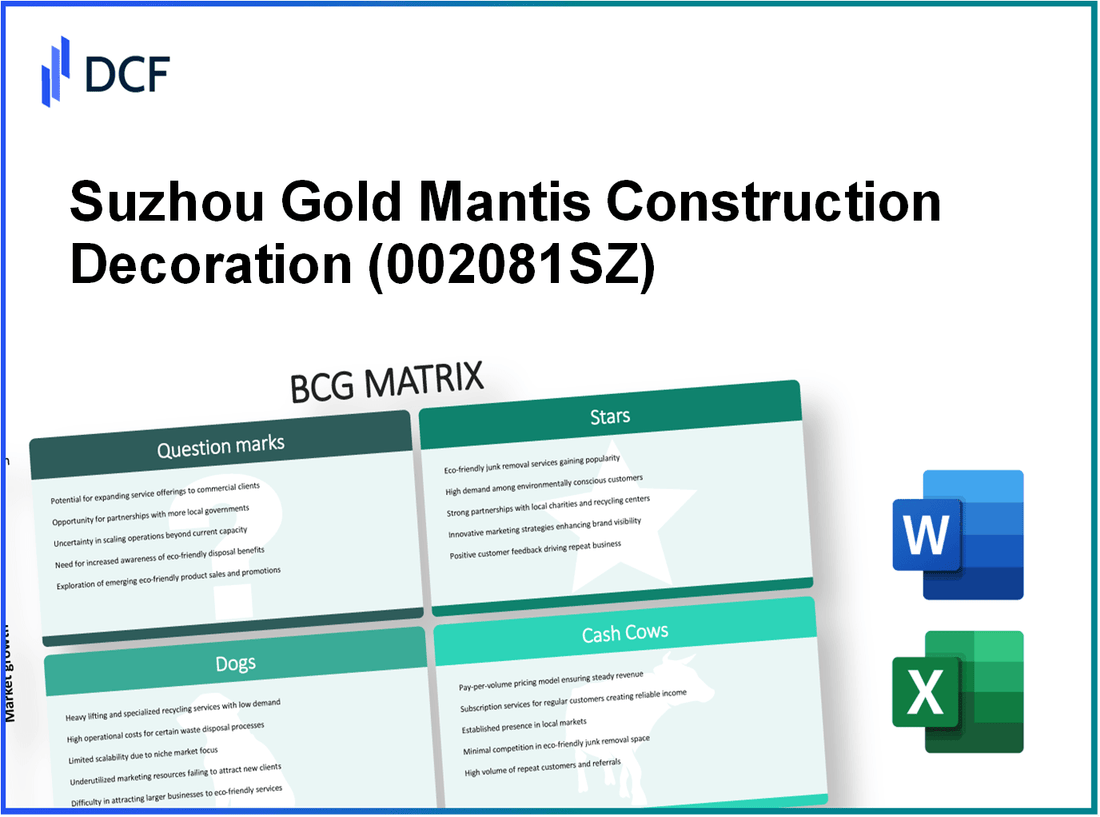
Suzhou Gold Mantis Construction Decoration Co., Ltd. (002081.SZ) - BCG Matrix Analysis: Stars
Public building decoration leads growth with high market share. Gold Mantis has sustained its position as the top player in the China Top 100 Building Decoration Industry for over 20 consecutive years and targets large-scale public infrastructure and cultural projects as primary growth engines. As of December 2025 the company attributes a significant portion of its CNY 16.98 billion total revenue to public building decoration contracts, capturing premium-margin projects driven by government and municipal investment in high-quality public spaces.
The company's award credentials-144 Luban Awards as of 2025-underpin its competitive advantage in securing landmark projects with higher average contract values and margins. Market dynamics favoring sustainable, high-quality public space delivery align with Gold Mantis's integrated design-and-build capabilities and reputation, allowing it to maintain a leading market share in this high-growth segment of the domestic market.
| Metric | Value (2025) | Notes |
|---|---|---|
| Total revenue | CNY 16.98 billion | Company consolidated revenue, FY 2025 |
| Public building decoration contribution | ~40% of revenue | Estimated share from large-scale public projects |
| Industry size (China) | USD 765.9 billion | Building completion and interior design industry, 2025 |
| Luban Awards | 144 awards | Industry prestige and technical validation |
| Market rank (building decoration) | Top 1 (20+ years) | China Top 100 Building Decoration Industry |
| Typical contract margin (public, premium) | Higher than company average | Reflects premium pricing on landmark projects |
Key operational and financial strengths supporting the public building "Star" status:
- Strong brand and track record (144 Luban Awards; long-term top ranking).
- Integrated design-to-construction capability enabling higher-value bids and risk control.
- Focus on sustainability and high-quality finishes aligned with market shifts.
- Concentration on large-scale, high-visibility projects that drive referral and repeat business.
EPC and whole-process consulting services capture rising demand. The company has intensified its focus on integrated EPC delivery and whole-process consulting by December 2025, positioning these offerings as a high-growth priority to control the value chain from design through procurement and final decoration. This strategic pivot improves schedule certainty, reduces subcontractor fragmentation, and enhances quality control.
Gold Mantis's EPC and consulting segment has delivered a trailing twelve-month ROI of 3.45% and helped sustain a consolidated gross margin near 13.58% in FY 2025 despite broader industry margin compression. Adoption of Building Information Modeling (BIM) and digital execution tools has reduced rework, optimized material procurement, and shortened project delivery cycles-factors that increase competitiveness for large public and complex private projects.
| Metric | Value (2025) | Implication |
|---|---|---|
| Segment ROI (T12) | 3.45% | Measured on EPC and whole-process consulting projects |
| Gross margin (company) | ~13.58% | Consolidated, FY 2025 |
| BIM adoption | Enterprise-wide implementation | Used for design coordination, clash detection, procurement optimization |
| Government support tailwinds | Policy-driven | Push for efficient construction methods and integrated delivery |
| Market position (EPC & consulting) | High market share in integrated services | Leader among building decoration firms expanding into EPC |
Competitive and execution advantages in the EPC/whole-process domain include:
- End-to-end project control from design through handover, improving margin capture.
- Digital construction tools (BIM) driving productivity and lower cost overruns.
- Standardized processes and supply chain relationships that support repeatable delivery at scale.
- Alignment with government efficiency initiatives, increasing tender access and win rates.
Collectively, public building decoration and the EPC/whole-process consulting units qualify as "Stars" in the BCG Matrix for Gold Mantis: high-growth segments where the company holds leading market share, generates premium projects and margins, and requires sustained investment to consolidate leadership and convert growth into long-term cash cows.
Suzhou Gold Mantis Construction Decoration Co., Ltd. (002081.SZ) - BCG Matrix Analysis: Cash Cows
Cash Cows
Architectural decoration remains the dominant revenue contributor. In the most recent fiscal year the architectural decoration segment generated 17.23 billion CNY of the total 18.33 billion CNY revenue, representing 93.99% of group revenue. The traditional decoration market's growth rate has stabilized (single-digit or low-single-digit annual growth), while Gold Mantis holds a dominant relative market share as an industry leader, supporting steady cash generation.
The segment's cash-generation and balance-sheet support are evidenced by retained earnings of 11.00 billion CNY as of September 2025. Despite a reported 9.2% year-on-year decline in total annual revenue, architectural decoration continues to fund strategic investments including technology adoption, process automation, and measured international expansion. Mature operations, standardized project delivery and disciplined cost controls underpin stable operating margins in this segment.
| Metric | Value | Notes / Timeframe |
|---|---|---|
| Total group revenue | 18.33 billion CNY | Most recent fiscal year |
| Architectural decoration revenue | 17.23 billion CNY | Most recent fiscal year; ~94% of group |
| Architectural segment share of revenue | 93.99% | Calculated |
| Annual revenue change (group) | -9.2% | Year-on-year decline |
| Retained earnings | 11.00 billion CNY | As of September 2025 |
| Market growth rate (traditional decoration) | Stabilized; low-single-digits | Industry observation |
| Role | Primary liquidity and cash generation | Funds expansion and capex |
Key operational and financial attributes of the architectural decoration cash cow:
- High revenue concentration: >90% of group revenue derived from the segment.
- Low to moderate market growth but high relative market share; leader pricing power in large-scale commercial and institutional projects.
- Strong free cash flow generation able to finance R&D, digitalization, and selective M&A without immediate external financing pressure.
- Disciplined cost control and standardized project management supporting margin stability despite top-line pressure.
Specialized furniture manufacturing provides steady internal support. The manufacturing and installation business supplies furniture and ancillary products that directly service the decoration projects, operating as a low-growth but reliable internal supply source that enhances margins through vertical integration.
| Metric | Value | Notes / Timeframe |
|---|---|---|
| Domestic revenue (group) | 16.98 billion CNY | Late 2025 |
| Contribution of manufacturing division | Steady portion of domestic revenue | Provides internal materials and finished goods for projects |
| Market growth (furniture manufacturing) | Low / mature | Limited external expansion opportunities |
| Primary role | Supportive internal margin provider | Reduces procurement costs, ensures quality control |
| Strategic benefit | Vertical integration advantage | Improves delivery timelines and margin resilience |
Operational and financial characteristics of the manufacturing cash cow:
- Stable internal demand: consistent orders from Gold Mantis' large-scale decoration projects ensure predictable throughput.
- Cost advantage: reduced reliance on external suppliers lowers procurement volatility and supports gross margin preservation.
- Low external market growth but high internal utilization; capacity can be reallocated for external sales if needed to smooth utilization.
- Contributes to consolidated liquidity by delivering reliable, predictable margins that complement architectural decoration cash flows.
Suzhou Gold Mantis Construction Decoration Co., Ltd. (002081.SZ) - BCG Matrix Analysis: Question Marks
Question Marks - Prefabricated building and modular construction show high potential. The global prefabricated/modular construction market is projected to grow at a CAGR of 6.67% through 2033; market estimates indicate a sector valuation exceeding USD 134 million in 2025 for the specific niche segments relevant to high-end fit-out and modular housing supply chains. Gold Mantis is investing in prefabricated technologies, targeting faster delivery cycles and reduced on-site carbon intensity. As of 2025 the company remains a leader in traditional interior decoration but holds a developing relative market share in specialized prefabricated housing and modular systems.
Question Marks - Prefabricated business unit characteristics, current metrics and risks are summarized below.
| Metric | Prefabricated / Modular Construction |
|---|---|
| Projected market CAGR (to 2033) | 6.67% |
| Estimated niche market value (2025) | USD 134 million+ |
| Gold Mantis relative market share (2025, estimate) | Low-to-moderate (under 10% in specialized modular supply) |
| CAPEX intensity (2023-2025) | High - factory tooling, CNC, modular assembly lines (CAPEX/segment revenue >30%) |
| Gross margin profile (initial) | Compressed due to scale-up and supply-chain setup (estimated 8-12%) |
| Time-to-scale | 2-5 years to reach profitable scale dependent on order flow and partnerships |
| Key competitors | Specialized modular manufacturers, national prefab builders, overseas low-cost producers |
| Primary risks | High CAPEX, technology adoption, certification/regulatory hurdles, price competition |
Question Marks - Smart home integration targets the high-tech residential market. Gold Mantis is increasingly integrating IoT, BMS (building management systems) and smart-home packages into high-end residential and commercial projects. Demand drivers in 2025 include energy-efficiency regulations, consumer preference for automation, and rising retrofit investments in premium buildings. Gold Mantis's current relative market share versus specialized smart-home integrators and technology firms remains low; initial commercial projects show elevated R&D and implementation costs which compress near-term margins.
Question Marks - Smart home unit characteristics, current metrics and risks are summarized below.
| Metric | Smart Home Integration (Gold Mantis) |
|---|---|
| Relevant market trend (2023-2028) | Rapid adoption of IoT; segmented CAGR for premium smart-home solutions estimated 10-14% regionally |
| Gold Mantis relative market share (2025, estimate) | Low (<5%) in standalone smart-home products; higher within bundled high-end fit-out projects |
| R&D and partnership spend (annual) | Significant - ongoing R&D + strategic alliances; estimated incremental spend 3-6% of corporate revenue allocated to tech initiatives |
| Margin profile (initial) | Lower gross margins due to hardware procurement and integration costs (estimated 5-10%) |
| Time-to-profitability | Medium term (3-4 years) if platform standardization and recurring services (maintenance, subscriptions) achieved |
| Key competitors | Tech firms, dedicated smart-home integrators, platform providers (domestic and international) |
| Primary risks | Rapid tech obsolescence, cybersecurity liability, need for certification and service infrastructure |
Strategic implications and near-term actions for Question Marks:
- Prioritize CAPEX allocation to modular production lines with staged investment milestones and break-evens modeled at 2-4 years.
- Form technology partnerships and OEM agreements to accelerate smart-home platform readiness and reduce upfront R&D burden.
- Target pilot projects that bundle high-margin fit-out contracts with prefabricated modules to capture cross-selling synergies.
- Implement margin-improvement programs: standardized module designs, supplier consolidation, and digital prefabrication to reduce variable cost per unit by an estimated 10-20% at scale.
- Establish KPIs: relative market share growth targets (reach 15-20% in targeted modular niches within 5 years), ROI thresholds for CAPEX projects (>15% IRR), and customer retention rates for smart-home service contracts (>70%).
Suzhou Gold Mantis Construction Decoration Co., Ltd. (002081.SZ) - BCG Matrix Analysis: Dogs
Dogs - International and mass-market residential businesses are classified as underperforming units with low relative market share and low market growth, requiring portfolio remediation or divestment.
International operations performance (annual comparison):
| Metric | Most Recent Year (CNY) | Prior Year (CNY) | Change |
|---|---|---|---|
| International revenue | 12,730,000,000 | 14,080,000,000 | -9.6% |
| International operating margin | 3.1% | 4.4% | -1.3 pp |
| International contribution to consolidated revenue | 18.4% | 20.9% | -2.5 pp |
| International EBITDA | 640,000,000 | 740,000,000 | -13.5% |
| Net income contribution from international | 210,000,000 | 320,000,000 | -34.4% |
| Headcount (international) | 4,500 | 5,100 | -11.8% |
International segment description:
- Revenue dropped from 14.08 billion CNY to 12.73 billion CNY in the latest year, reflecting an absolute decline of 1.35 billion CNY and a 9.6% contraction.
- Geopolitical tensions, local regulatory complexity, and weaker overseas demand have reduced project win rates and increased bid-to-win cycle times.
- Margins in foreign projects are below corporate average (3.1% operating margin vs. consolidated ~5.8%), increasing pressure on consolidated profitability.
- As of December 2025, the international division requires elevated management attention while contributing less to net income (approx. 210 million CNY).
Residential mass-market performance (metrics):
| Metric | Value |
|---|---|
| Segment revenue (latest) | 9,850,000,000 CNY |
| Segment net profit margin | 2.7% |
| Reported net income change (recent periods) | -43.2% |
| Backlog value (residential) | 7,200,000,000 CNY |
| Average contract ticket size | 350,000 CNY |
| Price competition index (relative) | High |
Residential segment description:
- Prolonged Chinese real estate downturn led to lower project volume and reduced new contract awards; backlog down year-over-year.
- Net profit margin compressed to 2.7% by late 2025 due to discounting, longer receivable cycles, and higher fixed-cost absorption per project.
- Net income decreased by over 43% attributable in part to underperforming traditional residential contracts and elevated provisioning.
- Private housing sector shows low market growth and intense price competition, offering limited ROI and strategic attractiveness.
Key risk indicators and operational burdens:
| Indicator | International | Residential Mass Market |
|---|---|---|
| Market growth rate (approx.) | 0-2% (low) | 0-1% (stagnant) |
| Relative market share | Low (declining) | Low (fragmented) |
| Average gross margin | 6.5% | 7.0% |
| Average net margin | 1.6% | 2.7% |
| Working capital intensity | High | High |
| Operational risk | High (regulatory + geopolitical) | High (volume and pricing pressure) |
Strategic management actions under consideration:
- Re-evaluating global footprint: close or divest non-core overseas subsidiaries where margin recovery is unlikely, target markets with stable regulations.
- Shift capital and management focus from low-growth residential contracts to higher-margin public, industrial, and specialized projects.
- Implement tighter bid pricing controls, enhance credit and receivables management, and increase project selection rigor to protect cash flow.
- Reduce overhead in underperforming divisions: headcount realignment (international down ~11.8% observed) and consolidation of regional offices.
Quantified near-term targets (management guidance):
| Target | Timeframe | Numeric goal |
|---|---|---|
| International revenue stabilization | 12 months | Limit decline to <5% yoy |
| Residential margin improvement | 12-18 months | Raise net margin from 2.7% to ≥4.0% |
| Reduce international overhead | 6-12 months | Cut SG&A in international by 10-15% |
| Divest non-core assets | 12-24 months | Dispose assets representing ≥2.0B CNY in revenue |
Disclaimer
All information, articles, and product details provided on this website are for general informational and educational purposes only. We do not claim any ownership over, nor do we intend to infringe upon, any trademarks, copyrights, logos, brand names, or other intellectual property mentioned or depicted on this site. Such intellectual property remains the property of its respective owners, and any references here are made solely for identification or informational purposes, without implying any affiliation, endorsement, or partnership.
We make no representations or warranties, express or implied, regarding the accuracy, completeness, or suitability of any content or products presented. Nothing on this website should be construed as legal, tax, investment, financial, medical, or other professional advice. In addition, no part of this site—including articles or product references—constitutes a solicitation, recommendation, endorsement, advertisement, or offer to buy or sell any securities, franchises, or other financial instruments, particularly in jurisdictions where such activity would be unlawful.
All content is of a general nature and may not address the specific circumstances of any individual or entity. It is not a substitute for professional advice or services. Any actions you take based on the information provided here are strictly at your own risk. You accept full responsibility for any decisions or outcomes arising from your use of this website and agree to release us from any liability in connection with your use of, or reliance upon, the content or products found herein.