
|
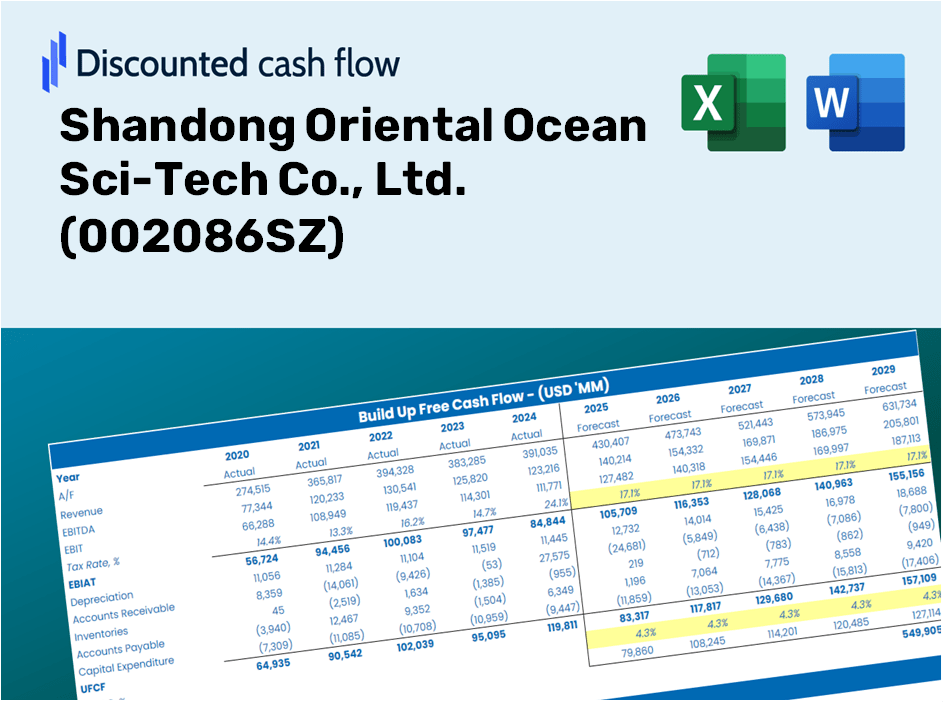
Shandong Oriental Ocean Sci-Tech Co., Ltd. (002086.SZ) Valoración de DCF |
Completamente Editable: Adáptelo A Sus Necesidades En Excel O Sheets
Diseño Profesional: Plantillas Confiables Y Estándares De La Industria
Predeterminadas Para Un Uso Rápido Y Eficiente
Compatible con MAC / PC, completamente desbloqueado
No Se Necesita Experiencia; Fáciles De Seguir
Shandong Oriental Ocean Sci-Tech Co., Ltd. (002086.SZ) Bundle
¡Optimice su tiempo y mejore la precisión con nuestra calculadora DCF (002086SZ)! Con el acceso a datos reales de Shandong Oriental Ocean Sci-Tech Co., Ltd. y suposiciones personalizables, esta herramienta le permite pronosticar, analizar y valor (002086SZ) como un inversor experto.
Benefits You Will Receive
- Comprehensive Financial Model: Utilizes Shandong Oriental Ocean Sci-Tech's actual data for accurate DCF valuation.
- Complete Forecasting Control: Modify revenue growth, profit margins, WACC, and other critical variables.
- Real-Time Calculations: Instant updates reflect changes immediately, providing immediate insights.
- Professional-Grade Template: An expertly crafted Excel file suitable for investor presentations and in-depth valuation.
- Flexible and Reusable: Designed for adaptability, allowing for ongoing use in detailed forecasting scenarios.
Key Features
- Comprehensive Historical Data: Access Shandong Oriental Ocean Sci-Tech Co., Ltd.'s (002086SZ) past financial statements along with pre-populated forecasts.
- Customizable Parameters: Adjust WACC, tax rates, revenue growth, and EBITDA margins to suit your analysis.
- Real-Time Insights: Witness the intrinsic value of Shandong Oriental Ocean Sci-Tech Co., Ltd. (002086SZ) update immediately.
- User-Friendly Visualizations: Interactive dashboard charts illustrate valuation outcomes and essential metrics.
- Designed for Precision: A reliable tool tailored for analysts, investors, and finance professionals.
How It Operates
- Download: Obtain the pre-configured Excel file containing Shandong Oriental Ocean Sci-Tech Co., Ltd.'s financial data.
- Customize: Modify your forecasts, such as revenue growth, EBITDA percentage, and WACC.
- Update Automatically: Watch as the intrinsic value and NPV calculations refresh in real-time.
- Test Scenarios: Generate various projections and instantly compare the results.
- Make Decisions: Leverage the valuation findings to inform your investment strategy.
Why Opt for This Calculator?
- Designed for Industry Experts: A sophisticated tool utilized by analysts, CFOs, and consultants.
- Up-to-Date Data: Shandong Oriental Ocean Sci-Tech Co., Ltd.’s (002086SZ) historical and projected financials preloaded for precision.
- Scenario Analysis: Effortlessly simulate various forecasts and assumptions.
- Transparent Results: Automatically computes intrinsic value, NPV, and essential metrics.
- User-Friendly: Step-by-step guidance helps you navigate the process with ease.
Who Should Utilize This Product?
- Individual Investors: Gain insights to make informed decisions regarding investments in Shandong Oriental Ocean Sci-Tech Co., Ltd. (002086SZ).
- Financial Analysts: Enhance efficiency in valuation with comprehensive financial models tailored for Shandong Oriental Ocean Sci-Tech Co., Ltd. (002086SZ).
- Consultants: Provide timely and precise valuation recommendations to clients focusing on Shandong Oriental Ocean Sci-Tech Co., Ltd. (002086SZ).
- Business Owners: Learn from the valuation practices of companies like Shandong Oriental Ocean Sci-Tech Co., Ltd. (002086SZ) to refine your business strategies.
- Finance Students: Explore valuation methods through the lens of real-world examples involving Shandong Oriental Ocean Sci-Tech Co., Ltd. (002086SZ).
What the Template Contains
- Historical Data: Includes Shandong Oriental Ocean Sci-Tech Co., Ltd.'s past financials and baseline forecasts.
- DCF and Levered DCF Models: Detailed templates to calculate the intrinsic value of Shandong Oriental Ocean Sci-Tech Co., Ltd. (002086SZ).
- WACC Sheet: Pre-built calculations for Weighted Average Cost of Capital.
- Editable Inputs: Modify key drivers such as growth rates, EBITDA %, and CAPEX assumptions.
- Quarterly and Annual Statements: A comprehensive breakdown of Shandong Oriental Ocean Sci-Tech Co., Ltd.'s financials.
- Interactive Dashboard: Visualize valuation results and projections dynamically.
Disclaimer
All information, articles, and product details provided on this website are for general informational and educational purposes only. We do not claim any ownership over, nor do we intend to infringe upon, any trademarks, copyrights, logos, brand names, or other intellectual property mentioned or depicted on this site. Such intellectual property remains the property of its respective owners, and any references here are made solely for identification or informational purposes, without implying any affiliation, endorsement, or partnership.
We make no representations or warranties, express or implied, regarding the accuracy, completeness, or suitability of any content or products presented. Nothing on this website should be construed as legal, tax, investment, financial, medical, or other professional advice. In addition, no part of this site—including articles or product references—constitutes a solicitation, recommendation, endorsement, advertisement, or offer to buy or sell any securities, franchises, or other financial instruments, particularly in jurisdictions where such activity would be unlawful.
All content is of a general nature and may not address the specific circumstances of any individual or entity. It is not a substitute for professional advice or services. Any actions you take based on the information provided here are strictly at your own risk. You accept full responsibility for any decisions or outcomes arising from your use of this website and agree to release us from any liability in connection with your use of, or reliance upon, the content or products found herein.