
|
Ningbo Kangqiang Electronics Co., Ltd (002119.sz) DCF Valoración |
Completamente Editable: Adáptelo A Sus Necesidades En Excel O Sheets
Diseño Profesional: Plantillas Confiables Y Estándares De La Industria
Predeterminadas Para Un Uso Rápido Y Eficiente
Compatible con MAC / PC, completamente desbloqueado
No Se Necesita Experiencia; Fáciles De Seguir
Ningbo Kangqiang Electronics Co., Ltd (002119.SZ) Bundle
¡Obtenga información sobre su análisis de valoración Ningbo Kangqiang Electronics Co., Ltd (002119SZ) con nuestra calculadora DCF de vanguardia! Equipado con datos reales (002119sz), esta plantilla de Excel le permite ajustar preventos y supuestos para determinar con precisión el valor intrínseco de Ningbo Kangqiang Electronics Co., Ltd.
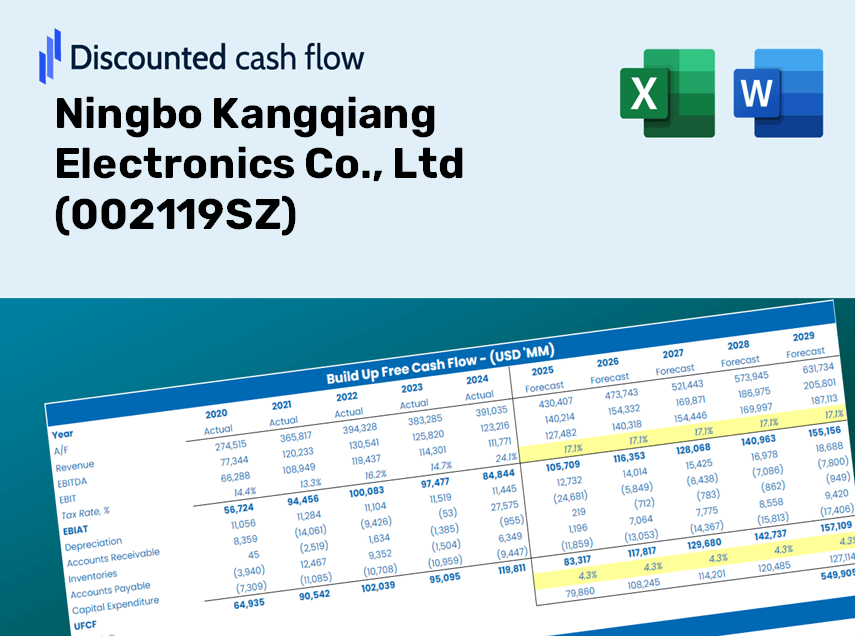
Discounted Cash Flow (DCF) - (USD MM)
| Year | AY1 2020 |
AY2 2021 |
AY3 2022 |
AY4 2023 |
AY5 2024 |
FY1 2025 |
FY2 2026 |
FY3 2027 |
FY4 2028 |
FY5 2029 |
|---|---|---|---|---|---|---|---|---|---|---|
| Revenue | 1,548.6 | 2,194.6 | 1,702.8 | 1,779.9 | 1,964.6 | 2,132.6 | 2,314.9 | 2,512.9 | 2,727.8 | 2,961.0 |
| Revenue Growth, % | 0 | 41.71 | -22.41 | 4.53 | 10.38 | 8.55 | 8.55 | 8.55 | 8.55 | 8.55 |
| EBITDA | 198.4 | 308.4 | 212.0 | 186.8 | 190.9 | 253.9 | 275.6 | 299.2 | 324.8 | 352.5 |
| EBITDA, % | 12.81 | 14.05 | 12.45 | 10.49 | 9.72 | 11.91 | 11.91 | 11.91 | 11.91 | 11.91 |
| Depreciation | 72.8 | 76.8 | 81.2 | 86.5 | 90.2 | 95.6 | 103.8 | 112.7 | 122.3 | 132.8 |
| Depreciation, % | 4.7 | 3.5 | 4.77 | 4.86 | 4.59 | 4.48 | 4.48 | 4.48 | 4.48 | 4.48 |
| EBIT | 125.7 | 231.6 | 130.8 | 100.2 | 100.7 | 158.3 | 171.8 | 186.5 | 202.4 | 219.7 |
| EBIT, % | 8.12 | 10.55 | 7.68 | 5.63 | 5.13 | 7.42 | 7.42 | 7.42 | 7.42 | 7.42 |
| Total Cash | 149.8 | 216.2 | 297.4 | 199.1 | 147.8 | 237.6 | 257.9 | 280.0 | 303.9 | 329.9 |
| Total Cash, percent | .0 | .0 | .0 | .0 | .0 | .0 | .0 | .0 | .0 | .0 |
| Account Receivables | 504.1 | 653.1 | 384.1 | 489.4 | 594.8 | 608.4 | 660.4 | 716.9 | 778.2 | 844.7 |
| Account Receivables, % | 32.55 | 29.76 | 22.56 | 27.5 | 30.27 | 28.53 | 28.53 | 28.53 | 28.53 | 28.53 |
| Inventories | 330.3 | 415.2 | 377.2 | 433.1 | 421.6 | 461.4 | 500.9 | 543.7 | 590.2 | 640.7 |
| Inventories, % | 21.33 | 18.92 | 22.15 | 24.33 | 21.46 | 21.64 | 21.64 | 21.64 | 21.64 | 21.64 |
| Accounts Payable | 198.9 | 304.8 | 90.9 | 211.5 | 238.0 | 239.1 | 259.6 | 281.8 | 305.9 | 332.0 |
| Accounts Payable, % | 12.84 | 13.89 | 5.34 | 11.88 | 12.11 | 11.21 | 11.21 | 11.21 | 11.21 | 11.21 |
| Capital Expenditure | -46.6 | -35.1 | -24.5 | -29.0 | -16.3 | -36.3 | -39.4 | -42.8 | -46.4 | -50.4 |
| Capital Expenditure, % | -3.01 | -1.6 | -1.44 | -1.63 | -0.82872 | -1.7 | -1.7 | -1.7 | -1.7 | -1.7 |
| Tax Rate, % | 0.40314 | 0.40314 | 0.40314 | 0.40314 | 0.40314 | 0.40314 | 0.40314 | 0.40314 | 0.40314 | 0.40314 |
| EBITAT | 118.5 | 209.1 | 122.6 | 99.7 | 100.3 | 151.1 | 164.0 | 178.1 | 193.3 | 209.8 |
| Depreciation | ||||||||||
| Changes in Account Receivables | ||||||||||
| Changes in Inventories | ||||||||||
| Changes in Accounts Payable | ||||||||||
| Capital Expenditure | ||||||||||
| UFCF | -490.9 | 122.8 | 272.4 | 116.7 | 106.8 | 158.1 | 157.4 | 170.9 | 185.5 | 201.3 |
| WACC, % | 4.59 | 4.58 | 4.59 | 4.61 | 4.61 | 4.6 | 4.6 | 4.6 | 4.6 | 4.6 |
| PV UFCF | ||||||||||
| SUM PV UFCF | 760.2 | |||||||||
| Long Term Growth Rate, % | 3.50 | |||||||||
| Free cash flow (T + 1) | 208 | |||||||||
| Terminal Value | 19,024 | |||||||||
| Present Terminal Value | 15,197 | |||||||||
| Enterprise Value | 15,957 | |||||||||
| Net Debt | 382 | |||||||||
| Equity Value | 15,575 | |||||||||
| Diluted Shares Outstanding, MM | 375 | |||||||||
| Equity Value Per Share | 41.50 |
Benefits You Will Enjoy
- Comprehensive 002119SZ Financial Data: Pre-loaded with Ningbo Kangqiang Electronics’ historical and forecasted figures for accurate analysis.
- Customizable Template: Effortlessly adjust key variables such as revenue growth, WACC, and EBITDA percentage.
- Instant Calculations: Watch the intrinsic value of Ningbo Kangqiang Electronics update in real-time as you make changes.
- Professional Valuation Tool: Tailored for investors, analysts, and consultants in pursuit of reliable DCF results.
- User-Friendly Interface: Designed with a straightforward layout and clear instructions suitable for all skill levels.
Key Features
- 🔍 Real-Life Ningbo Kangqiang Financials: Pre-filled historical and projected data for Ningbo Kangqiang Electronics Co., Ltd (002119SZ).
- ✏️ Fully Customizable Inputs: Modify essential parameters (yellow cells) such as WACC, growth %, and tax rates.
- 📊 Professional DCF Valuation: Integrated formulas provide Ningbo Kangqiang’s intrinsic value using the Discounted Cash Flow analysis.
- ⚡ Instant Results: Immediately visualize Ningbo Kangqiang’s valuation after adjustments.
- Scenario Analysis: Evaluate and compare outcomes for different financial assumptions side-by-side.
How It Functions
- Step 1: Download the Excel file.
- Step 2: Examine the pre-filled data for Ningbo Kangqiang Electronics Co., Ltd (002119SZ) - both historical and projected.
- Step 3: Modify key assumptions (highlighted in yellow) based on your evaluation.
- Step 4: Observe the automatic recalculations for the intrinsic value of Ningbo Kangqiang Electronics Co., Ltd (002119SZ).
- Step 5: Utilize the results for your investment strategies or reporting needs.
Why Select the Ningbo Kangqiang Electronics Calculator?
- Time-Efficient: Skip the hassle of building a DCF model from the ground up – it's instantly usable.
- Enhanced Precision: Access to dependable financial data and formulas minimizes valuation errors.
- Completely Customizable: Adjust the model to align with your unique assumptions and forecasts.
- User-Friendly: Intuitive charts and outputs facilitate straightforward analysis of the results.
- Preferred by Professionals: Crafted for experts who prioritize accuracy and functionality.
Who Can Benefit from This Product?
- Investors: Analyze the fair value of Ningbo Kangqiang Electronics Co., Ltd (002119SZ) to make informed investment choices.
- CFOs: Utilize a top-tier DCF model for accurate financial reporting and analysis.
- Consultants: Effortlessly modify the template for tailored valuation reports for clients.
- Entrepreneurs: Understand the financial modeling techniques employed by leading companies.
- Educators: Incorporate it as a resource to teach valuation methodologies effectively.
Contents of the Template
- Operating and Balance Sheet Data: Pre-filled historical data and forecasts for Ningbo Kangqiang Electronics Co., Ltd (002119SZ), including metrics such as revenue, EBITDA, EBIT, and capital expenditures.
- WACC Calculation: A specific sheet for the Weighted Average Cost of Capital (WACC), detailing parameters such as Beta, risk-free rate, and share price.
- DCF Valuation (Unlevered and Levered): Customizable Discounted Cash Flow models that display intrinsic value along with comprehensive calculations.
- Financial Statements: Pre-loaded financial statements (annual and quarterly) to facilitate analysis.
- Key Ratios: Provides profitability, leverage, and efficiency ratios relevant to Ningbo Kangqiang Electronics Co., Ltd (002119SZ).
- Dashboard and Charts: A visual summary of valuation outputs and assumptions for easy analysis of results.
Disclaimer
All information, articles, and product details provided on this website are for general informational and educational purposes only. We do not claim any ownership over, nor do we intend to infringe upon, any trademarks, copyrights, logos, brand names, or other intellectual property mentioned or depicted on this site. Such intellectual property remains the property of its respective owners, and any references here are made solely for identification or informational purposes, without implying any affiliation, endorsement, or partnership.
We make no representations or warranties, express or implied, regarding the accuracy, completeness, or suitability of any content or products presented. Nothing on this website should be construed as legal, tax, investment, financial, medical, or other professional advice. In addition, no part of this site—including articles or product references—constitutes a solicitation, recommendation, endorsement, advertisement, or offer to buy or sell any securities, franchises, or other financial instruments, particularly in jurisdictions where such activity would be unlawful.
All content is of a general nature and may not address the specific circumstances of any individual or entity. It is not a substitute for professional advice or services. Any actions you take based on the information provided here are strictly at your own risk. You accept full responsibility for any decisions or outcomes arising from your use of this website and agree to release us from any liability in connection with your use of, or reliance upon, the content or products found herein.