
|
Yoozoo Interactive Co., Ltd. (002174.sz) Valoración de DCF |
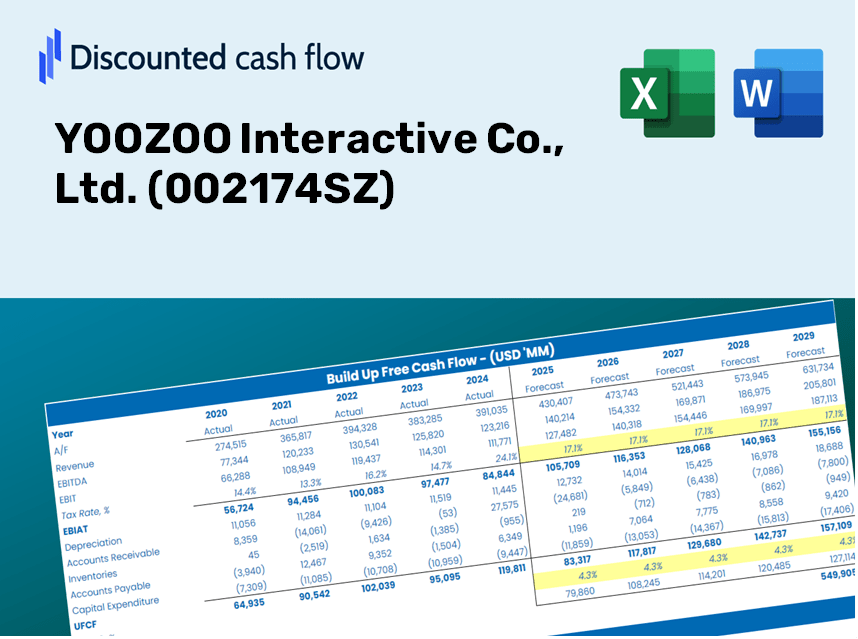
Completamente Editable: Adáptelo A Sus Necesidades En Excel O Sheets
Diseño Profesional: Plantillas Confiables Y Estándares De La Industria
Predeterminadas Para Un Uso Rápido Y Eficiente
Compatible con MAC / PC, completamente desbloqueado
No Se Necesita Experiencia; Fáciles De Seguir
YOOZOO Interactive Co., Ltd. (002174.SZ) Bundle
¡Simplifique la valoración de Yoozoo Interactive Co., Ltd. (002174sz) con esta calculadora DCF personalizable! Con Real Yoozoo Interactive Co., Ltd. (002174sz) financieras y entradas de pronóstico ajustables, puede probar escenarios y descubrir Yoozoo Interactive Co., Ltd. (002174sz) valor razonable en minutos.
Discounted Cash Flow (DCF) - (USD MM)
| Year | AY1 2020 |
AY2 2021 |
AY3 2022 |
AY4 2023 |
AY5 2024 |
FY1 2025 |
FY2 2026 |
FY3 2027 |
FY4 2028 |
FY5 2029 |
|---|---|---|---|---|---|---|---|---|---|---|
| Revenue | 4,703.1 | 3,204.4 | 1,980.6 | 1,625.4 | 1,434.4 | 1,076.7 | 808.2 | 606.7 | 455.4 | 341.8 |
| Revenue Growth, % | 0 | -31.87 | -38.19 | -17.93 | -11.75 | -24.94 | -24.94 | -24.94 | -24.94 | -24.94 |
| EBITDA | 304.5 | 356.8 | 212.8 | 300.4 | 131.5 | 120.6 | 90.5 | 67.9 | 51.0 | 38.3 |
| EBITDA, % | 6.47 | 11.14 | 10.74 | 18.48 | 9.17 | 11.2 | 11.2 | 11.2 | 11.2 | 11.2 |
| Depreciation | 209.8 | 281.6 | 274.6 | 176.9 | 185.5 | 109.7 | 82.3 | 61.8 | 46.4 | 34.8 |
| Depreciation, % | 4.46 | 8.79 | 13.87 | 10.88 | 12.93 | 10.19 | 10.19 | 10.19 | 10.19 | 10.19 |
| EBIT | 94.7 | 75.2 | -61.9 | 123.5 | -54.0 | 10.9 | 8.2 | 6.2 | 4.6 | 3.5 |
| EBIT, % | 2.01 | 2.35 | -3.12 | 7.6 | -3.77 | 1.01 | 1.01 | 1.01 | 1.01 | 1.01 |
| Total Cash | 1,747.0 | 1,430.9 | 1,639.5 | 1,494.3 | 1,773.8 | 767.7 | 576.3 | 432.6 | 324.7 | 243.7 |
| Total Cash, percent | .0 | .0 | .0 | .0 | .0 | .0 | .0 | .0 | .0 | .0 |
| Account Receivables | 1,857.7 | 466.2 | 369.2 | 299.7 | 281.2 | 238.5 | 179.0 | 134.4 | 100.9 | 75.7 |
| Account Receivables, % | 39.5 | 14.55 | 18.64 | 18.44 | 19.6 | 22.15 | 22.15 | 22.15 | 22.15 | 22.15 |
| Inventories | -142.2 | -3.2 | -94.6 | .0 | .0 | -17.0 | -12.8 | -9.6 | -7.2 | -5.4 |
| Inventories, % | -3.02 | -0.09897759 | -4.78 | 0 | 0 | -1.58 | -1.58 | -1.58 | -1.58 | -1.58 |
| Accounts Payable | 617.0 | 349.3 | 461.9 | 279.1 | 307.2 | 185.0 | 138.9 | 104.3 | 78.3 | 58.7 |
| Accounts Payable, % | 13.12 | 10.9 | 23.32 | 17.17 | 21.42 | 17.18 | 17.18 | 17.18 | 17.18 | 17.18 |
| Capital Expenditure | -236.8 | -65.3 | -42.2 | -17.5 | -37.7 | -27.8 | -20.9 | -15.7 | -11.8 | -8.8 |
| Capital Expenditure, % | -5.04 | -2.04 | -2.13 | -1.08 | -2.63 | -2.58 | -2.58 | -2.58 | -2.58 | -2.58 |
| Tax Rate, % | -6.56 | -6.56 | -6.56 | -6.56 | -6.56 | -6.56 | -6.56 | -6.56 | -6.56 | -6.56 |
| EBITAT | 738.5 | 69.3 | -61.8 | 134.6 | -57.6 | 10.7 | 8.1 | 6.1 | 4.5 | 3.4 |
| Depreciation | ||||||||||
| Changes in Account Receivables | ||||||||||
| Changes in Inventories | ||||||||||
| Changes in Accounts Payable | ||||||||||
| Capital Expenditure | ||||||||||
| UFCF | -387.1 | 1,270.4 | 471.7 | 86.1 | 136.9 | 30.2 | 78.6 | 59.0 | 44.3 | 33.2 |
| WACC, % | 10.6 | 10.57 | 10.6 | 10.6 | 10.6 | 10.59 | 10.59 | 10.59 | 10.59 | 10.59 |
| PV UFCF | ||||||||||
| SUM PV UFCF | 184.9 | |||||||||
| Long Term Growth Rate, % | 2.00 | |||||||||
| Free cash flow (T + 1) | 34 | |||||||||
| Terminal Value | 395 | |||||||||
| Present Terminal Value | 239 | |||||||||
| Enterprise Value | 424 | |||||||||
| Net Debt | -535 | |||||||||
| Equity Value | 958 | |||||||||
| Diluted Shares Outstanding, MM | 898 | |||||||||
| Equity Value Per Share | 1.07 |
What You Will Receive
- Genuine YOOZOO Data: Preloaded financial metrics – from revenue to EBIT – based on actual and projected data.
- Comprehensive Customization: Modify all essential parameters (yellow cells) such as WACC, growth %, and tax rates.
- Immediate Valuation Adjustments: Automatic recalculations to evaluate the effects of changes on YOOZOO's fair value.
- Flexible Excel Template: Designed for quick modifications, scenario analysis, and detailed forecasts.
- Time-Efficient and Reliable: Avoid the hassle of building models from the ground up while ensuring accuracy and adaptability.
Outstanding Features
- Genuine YOOZOO Financial Data: Access reliable pre-loaded historical figures and future estimates.
- Personalized Forecast Parameters: Modify the yellow-highlighted fields such as WACC, growth rates, and profit margins.
- Automated Calculations: Real-time updates for DCF, Net Present Value (NPV), and cash flow evaluations.
- Interactive Dashboard: User-friendly charts and summaries to clearly present your valuation findings.
- Designed for All Skill Levels: An intuitive layout tailored for investors, CFOs, and consultants alike.
How It Functions
- 1. Access the Template: Download and open the Excel file featuring YOOZOO Interactive Co., Ltd.'s (002174SZ) preloaded data.
- 2. Modify Assumptions: Adjust essential inputs such as growth rates, WACC, and capital expenditures.
- 3. Instant Result Visualization: The DCF model automatically calculates intrinsic value and NPV in real-time.
- 4. Explore Different Scenarios: Analyze various forecasts to assess different valuation outcomes.
- 5. Make Informed Decisions: Present professional valuation insights to enhance your strategic choices.
Why Choose This Calculator for YOOZOO Interactive Co., Ltd. (002174SZ)?
- Accurate Data: Access reliable financials for YOOZOO to generate trustworthy valuation outcomes.
- Customizable: Tailor key variables such as growth rates, WACC, and tax rates to align with your forecasts.
- Time-Saving: Utilize ready-made calculations to streamline your process and avoid starting from square one.
- Professional-Grade Tool: Specifically crafted for investors, analysts, and consultants working with YOOZOO.
- User-Friendly: Featuring an intuitive interface and comprehensive instructions for ease of use by all individuals.
Who Could Benefit from This Product?
- Investors: Accurately assess YOOZOO Interactive Co., Ltd.'s fair value before making investment choices.
- CFOs: Utilize a professional-grade DCF model for comprehensive financial reporting and analysis.
- Consultants: Easily modify the template for client valuation reports.
- Entrepreneurs: Discover financial modeling insights employed by leading firms.
- Educators: Employ it as a teaching resource to illustrate various valuation methodologies.
What the Template Includes
- Historical Data: Contains YOOZOO Interactive Co., Ltd.'s (002174SZ) previous financial performance and baseline forecasts.
- DCF and Levered DCF Models: Comprehensive templates designed to assess YOOZOO's intrinsic value.
- WACC Sheet: Pre-configured calculations for Weighted Average Cost of Capital.
- Editable Inputs: Customize essential drivers such as growth rates, EBITDA %, and CAPEX assumptions.
- Quarterly and Annual Statements: A thorough analysis of YOOZOO's financials.
- Interactive Dashboard: Dynamically visualize valuation outcomes and projections.
Disclaimer
All information, articles, and product details provided on this website are for general informational and educational purposes only. We do not claim any ownership over, nor do we intend to infringe upon, any trademarks, copyrights, logos, brand names, or other intellectual property mentioned or depicted on this site. Such intellectual property remains the property of its respective owners, and any references here are made solely for identification or informational purposes, without implying any affiliation, endorsement, or partnership.
We make no representations or warranties, express or implied, regarding the accuracy, completeness, or suitability of any content or products presented. Nothing on this website should be construed as legal, tax, investment, financial, medical, or other professional advice. In addition, no part of this site—including articles or product references—constitutes a solicitation, recommendation, endorsement, advertisement, or offer to buy or sell any securities, franchises, or other financial instruments, particularly in jurisdictions where such activity would be unlawful.
All content is of a general nature and may not address the specific circumstances of any individual or entity. It is not a substitute for professional advice or services. Any actions you take based on the information provided here are strictly at your own risk. You accept full responsibility for any decisions or outcomes arising from your use of this website and agree to release us from any liability in connection with your use of, or reliance upon, the content or products found herein.