
|
Zhe Jiang Dali Technology Co., Ltd (002214.sz) Valoración de DCF |
Completamente Editable: Adáptelo A Sus Necesidades En Excel O Sheets
Diseño Profesional: Plantillas Confiables Y Estándares De La Industria
Predeterminadas Para Un Uso Rápido Y Eficiente
Compatible con MAC / PC, completamente desbloqueado
No Se Necesita Experiencia; Fáciles De Seguir
Zhe Jiang Dali Technology Co.,Ltd (002214.SZ) Bundle
¡Mejore sus estrategias de inversión con la calculadora DCF [símbolo]! Explore los datos financieros auténticos de Zhe Jiang Dali Technology Co., LTD, ajuste las proyecciones y gastos de crecimiento, y observen instantáneamente cómo estas modificaciones afectan el valor intrínseco [símbolo].
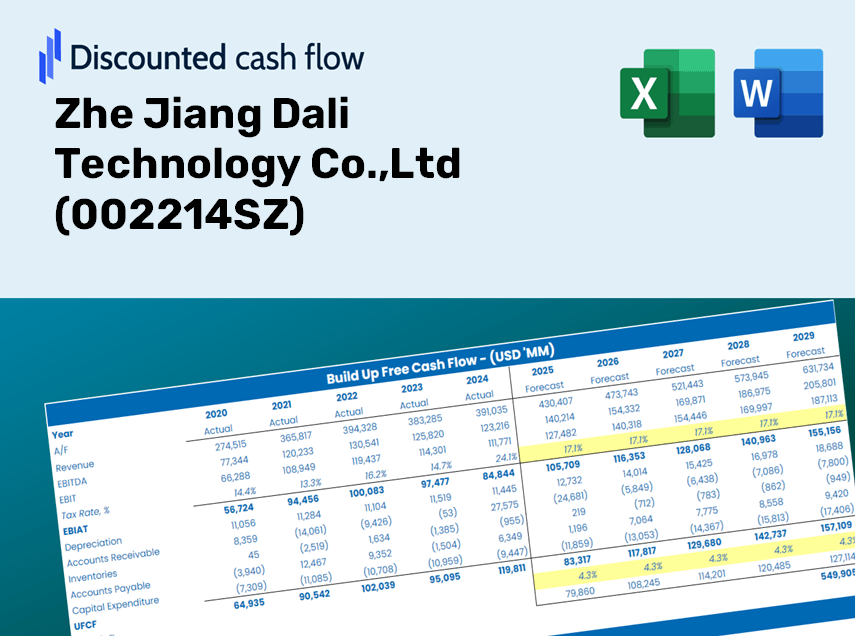
Discounted Cash Flow (DCF) - (USD MM)
| Year | AY1 2020 |
AY2 2021 |
AY3 2022 |
AY4 2023 |
AY5 2024 |
FY1 2025 |
FY2 2026 |
FY3 2027 |
FY4 2028 |
FY5 2029 |
|---|---|---|---|---|---|---|---|---|---|---|
| Revenue | 1,090.2 | 805.4 | 400.8 | 254.6 | 274.8 | 202.8 | 149.6 | 110.4 | 81.4 | 60.1 |
| Revenue Growth, % | 0 | -26.12 | -50.24 | -36.49 | 7.97 | -26.22 | -26.22 | -26.22 | -26.22 | -26.22 |
| EBITDA | 481.4 | 126.2 | -170.0 | -267.2 | -370.8 | -74.0 | -54.6 | -40.3 | -29.7 | -21.9 |
| EBITDA, % | 44.16 | 15.67 | -42.41 | -104.96 | -134.93 | -36.52 | -36.52 | -36.52 | -36.52 | -36.52 |
| Depreciation | 22.5 | 27.5 | 33.1 | 36.2 | 38.5 | 17.0 | 12.6 | 9.3 | 6.8 | 5.0 |
| Depreciation, % | 2.07 | 3.41 | 8.25 | 14.24 | 14.02 | 8.4 | 8.4 | 8.4 | 8.4 | 8.4 |
| EBIT | 458.9 | 98.8 | -203.0 | -303.4 | -409.4 | -79.6 | -58.7 | -43.3 | -32.0 | -23.6 |
| EBIT, % | 42.09 | 12.26 | -50.66 | -119.19 | -148.95 | -39.26 | -39.26 | -39.26 | -39.26 | -39.26 |
| Total Cash | 140.8 | 739.2 | 500.7 | 274.5 | 160.3 | 147.2 | 108.6 | 80.1 | 59.1 | 43.6 |
| Total Cash, percent | .0 | .0 | .0 | .0 | .0 | .0 | .0 | .0 | .0 | .0 |
| Account Receivables | 727.4 | 937.4 | 938.4 | 809.3 | 653.9 | 189.3 | 139.6 | 103.0 | 76.0 | 56.1 |
| Account Receivables, % | 66.72 | 116.39 | 234.13 | 317.92 | 237.95 | 93.34 | 93.34 | 93.34 | 93.34 | 93.34 |
| Inventories | 441.4 | 445.5 | 510.4 | 511.1 | 500.1 | 160.5 | 118.4 | 87.4 | 64.5 | 47.6 |
| Inventories, % | 40.49 | 55.32 | 127.34 | 200.77 | 181.96 | 79.16 | 79.16 | 79.16 | 79.16 | 79.16 |
| Accounts Payable | 109.2 | 181.5 | 263.4 | 209.5 | 235.0 | 107.9 | 79.6 | 58.7 | 43.3 | 32.0 |
| Accounts Payable, % | 10.02 | 22.53 | 65.73 | 82.32 | 85.52 | 53.22 | 53.22 | 53.22 | 53.22 | 53.22 |
| Capital Expenditure | -55.7 | -189.3 | -105.0 | -125.3 | -89.0 | -55.3 | -40.8 | -30.1 | -22.2 | -16.4 |
| Capital Expenditure, % | -5.11 | -23.5 | -26.19 | -49.23 | -32.38 | -27.28 | -27.28 | -27.28 | -27.28 | -27.28 |
| Tax Rate, % | 8.44 | 8.44 | 8.44 | 8.44 | 8.44 | 8.44 | 8.44 | 8.44 | 8.44 | 8.44 |
| EBITAT | 395.7 | 94.7 | -157.9 | -286.9 | -374.8 | -71.0 | -52.4 | -38.7 | -28.5 | -21.0 |
| Depreciation | ||||||||||
| Changes in Account Receivables | ||||||||||
| Changes in Inventories | ||||||||||
| Changes in Accounts Payable | ||||||||||
| Capital Expenditure | ||||||||||
| UFCF | -697.1 | -209.0 | -213.6 | -301.5 | -233.5 | 567.8 | -17.2 | -12.7 | -9.4 | -6.9 |
| WACC, % | 5.64 | 5.65 | 5.63 | 5.65 | 5.65 | 5.65 | 5.65 | 5.65 | 5.65 | 5.65 |
| PV UFCF | ||||||||||
| SUM PV UFCF | 498.5 | |||||||||
| Long Term Growth Rate, % | 2.00 | |||||||||
| Free cash flow (T + 1) | -7 | |||||||||
| Terminal Value | -194 | |||||||||
| Present Terminal Value | -147 | |||||||||
| Enterprise Value | 351 | |||||||||
| Net Debt | 130 | |||||||||
| Equity Value | 221 | |||||||||
| Diluted Shares Outstanding, MM | 591 | |||||||||
| Equity Value Per Share | 0.37 |
What You Will Receive
- Accurate Zhe Jiang Dali Financials: Comprehensive historical and projected data for precise valuation.
- Customizable Parameters: Adjust WACC, tax rates, revenue growth, and capital expenditures to fit your analysis.
- Dynamic Calculations: Intrinsic value and NPV are computed automatically.
- Scenario Testing: Evaluate various scenarios to assess the future performance of Zhe Jiang Dali Technology Co., Ltd (002214SZ).
- User-Friendly Interface: Designed for professionals but user-friendly for newcomers.
Core Highlights
- Accurate Zhe Jiang Dali Data: Includes comprehensive historical financial data and projections for the future.
- Customizable Assumptions: Modify factors such as revenue growth rates, profit margins, discount rates, tax implications, and capital investments.
- Interactive Valuation Framework: Automatically refreshes Net Present Value (NPV) and intrinsic value based on your adjustments.
- Scenario Analysis: Develop various forecasting scenarios to evaluate different valuation possibilities.
- Intuitive Interface: Clear, organized layout suitable for both experienced professionals and newcomers.
How It Works
- Step 1: Download the Excel file for Zhe Jiang Dali Technology Co.,Ltd (002214SZ).
- Step 2: Examine the pre-filled financial data and forecasts provided for Zhe Jiang Dali Technology Co.,Ltd (002214SZ).
- Step 3: Adjust key inputs such as revenue growth, WACC, and tax rates (highlighted cells).
- Step 4: Observe the DCF model update in real-time as you modify your assumptions.
- Step 5: Review the outputs and leverage the results to inform your investment decisions.
Why Opt for This Calculator?
- Designed for Experts: A sophisticated tool favored by analysts, CFOs, and consultants in the industry.
- Comprehensive Data: Historical and projected financials of Zhe Jiang Dali Technology Co.,Ltd (002214SZ) preloaded for precision.
- Flexible Scenario Analysis: Effortlessly explore various forecasts and assumptions.
- Clear and Concise Outputs: Instantly computes intrinsic value, NPV, and other essential metrics.
- User-Friendly: Step-by-step guidance simplifies the entire process.
Who Can Benefit from Zhe Jiang Dali Technology Co., Ltd (002214SZ)?
- Investors: Make informed decisions using a top-tier valuation tool tailored for precision.
- Financial Analysts: Streamline your workflow with a customizable, pre-configured DCF model.
- Consultants: Effortlessly modify the template for impactful client presentations or reports.
- Finance Enthusiasts: Enhance your knowledge of valuation methods with practical, real-life examples.
- Educators and Students: Leverage it as an effective educational resource in finance-related disciplines.
What the Template Includes
- Preloaded Zhe Jiang Dali Tech Data: Historical and projected financial information, encompassing revenue, EBIT, and capital expenditures.
- DCF and WACC Models: Sophisticated sheets designed for calculating intrinsic value and Weighted Average Cost of Capital.
- Editable Inputs: Yellow-highlighted cells for modifying revenue growth rates, tax percentages, and discount rates.
- Financial Statements: Detailed annual and quarterly financials for in-depth analysis.
- Key Ratios: Metrics covering profitability, leverage, and efficiency to assess performance.
- Dashboard and Charts: Visual representations of valuation results and underlying assumptions.
Disclaimer
All information, articles, and product details provided on this website are for general informational and educational purposes only. We do not claim any ownership over, nor do we intend to infringe upon, any trademarks, copyrights, logos, brand names, or other intellectual property mentioned or depicted on this site. Such intellectual property remains the property of its respective owners, and any references here are made solely for identification or informational purposes, without implying any affiliation, endorsement, or partnership.
We make no representations or warranties, express or implied, regarding the accuracy, completeness, or suitability of any content or products presented. Nothing on this website should be construed as legal, tax, investment, financial, medical, or other professional advice. In addition, no part of this site—including articles or product references—constitutes a solicitation, recommendation, endorsement, advertisement, or offer to buy or sell any securities, franchises, or other financial instruments, particularly in jurisdictions where such activity would be unlawful.
All content is of a general nature and may not address the specific circumstances of any individual or entity. It is not a substitute for professional advice or services. Any actions you take based on the information provided here are strictly at your own risk. You accept full responsibility for any decisions or outcomes arising from your use of this website and agree to release us from any liability in connection with your use of, or reliance upon, the content or products found herein.