
|
Shenzhen Topway Video Communication Co., Ltd (002238.sz) DCF Valoración |
Completamente Editable: Adáptelo A Sus Necesidades En Excel O Sheets
Diseño Profesional: Plantillas Confiables Y Estándares De La Industria
Predeterminadas Para Un Uso Rápido Y Eficiente
Compatible con MAC / PC, completamente desbloqueado
No Se Necesita Experiencia; Fáciles De Seguir
Shenzhen Topway Video Communication Co., Ltd (002238.SZ) Bundle
¡Evalúe Shenzhen Topway Video Communication Co., las perspectivas financieras de LTD como un experto! Esta calculadora DCF (002238SZ) le proporciona finanzas precarias y una amplia flexibilidad para modificar el crecimiento de los ingresos, WACC, los márgenes y otros supuestos críticos para alinearse con sus proyecciones.
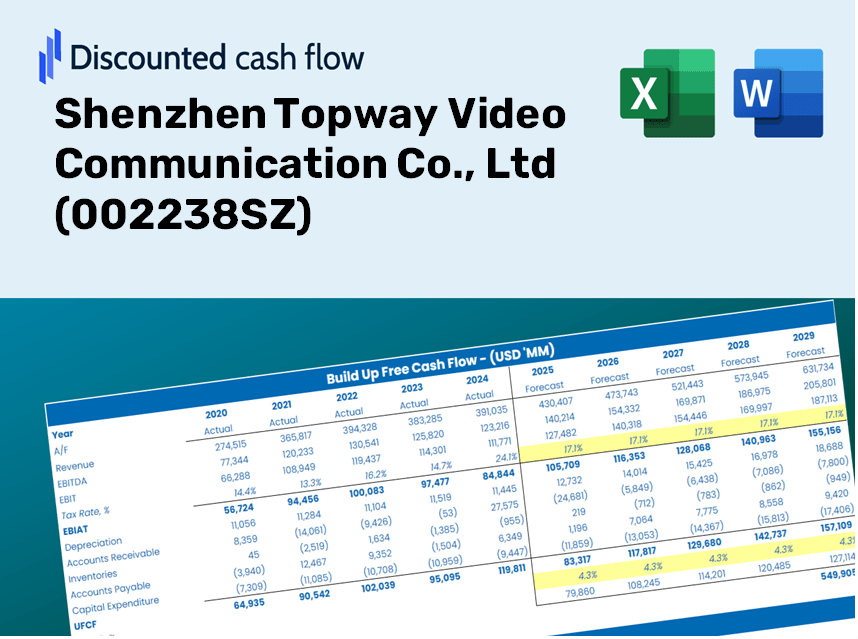
Discounted Cash Flow (DCF) - (USD MM)
| Year | AY1 2020 |
AY2 2021 |
AY3 2022 |
AY4 2023 |
AY5 2024 |
FY1 2025 |
FY2 2026 |
FY3 2027 |
FY4 2028 |
FY5 2029 |
|---|---|---|---|---|---|---|---|---|---|---|
| Revenue | 1,743.9 | 1,779.5 | 1,504.9 | 1,477.7 | 1,297.0 | 1,208.0 | 1,125.2 | 1,048.0 | 976.2 | 909.2 |
| Revenue Growth, % | 0 | 2.04 | -15.43 | -1.81 | -12.23 | -6.86 | -6.86 | -6.86 | -6.86 | -6.86 |
| EBITDA | 476.2 | 468.7 | 342.4 | 432.0 | 280.2 | 307.4 | 286.3 | 266.7 | 248.4 | 231.4 |
| EBITDA, % | 27.31 | 26.34 | 22.75 | 29.24 | 21.6 | 25.45 | 25.45 | 25.45 | 25.45 | 25.45 |
| Depreciation | 276.1 | 304.9 | 298.8 | 305.9 | 260.9 | 226.2 | 210.7 | 196.3 | 182.8 | 170.3 |
| Depreciation, % | 15.83 | 17.13 | 19.85 | 20.7 | 20.12 | 18.73 | 18.73 | 18.73 | 18.73 | 18.73 |
| EBIT | 200.1 | 163.8 | 43.6 | 126.1 | 19.3 | 81.2 | 75.6 | 70.4 | 65.6 | 61.1 |
| EBIT, % | 11.47 | 9.2 | 2.9 | 8.53 | 1.49 | 6.72 | 6.72 | 6.72 | 6.72 | 6.72 |
| Total Cash | 1,122.3 | 921.5 | 1,130.0 | 1,010.0 | 1,085.5 | 829.4 | 772.5 | 719.5 | 670.2 | 624.2 |
| Total Cash, percent | .0 | .0 | .0 | .0 | .0 | .0 | .0 | .0 | .0 | .0 |
| Account Receivables | 272.0 | 322.1 | 384.8 | 386.1 | 272.7 | 257.1 | 239.5 | 223.1 | 207.8 | 193.5 |
| Account Receivables, % | 15.59 | 18.1 | 25.57 | 26.13 | 21.03 | 21.28 | 21.28 | 21.28 | 21.28 | 21.28 |
| Inventories | 61.4 | 40.3 | 27.4 | 29.3 | 43.2 | 31.2 | 29.1 | 27.1 | 25.2 | 23.5 |
| Inventories, % | 3.52 | 2.27 | 1.82 | 1.98 | 3.33 | 2.58 | 2.58 | 2.58 | 2.58 | 2.58 |
| Accounts Payable | 435.9 | 484.3 | 624.4 | 636.5 | 569.9 | 436.6 | 406.7 | 378.8 | 352.8 | 328.6 |
| Accounts Payable, % | 24.99 | 27.22 | 41.49 | 43.07 | 43.94 | 36.14 | 36.14 | 36.14 | 36.14 | 36.14 |
| Capital Expenditure | -243.8 | -269.8 | -312.7 | -614.7 | -141.6 | -247.5 | -230.5 | -214.7 | -200.0 | -186.3 |
| Capital Expenditure, % | -13.98 | -15.16 | -20.78 | -41.6 | -10.92 | -20.49 | -20.49 | -20.49 | -20.49 | -20.49 |
| Tax Rate, % | 139.88 | 139.88 | 139.88 | 139.88 | 139.88 | 139.88 | 139.88 | 139.88 | 139.88 | 139.88 |
| EBITAT | 201.3 | 164.9 | 44.8 | 145.8 | -7.7 | 64.9 | 60.5 | 56.3 | 52.5 | 48.9 |
| Depreciation | ||||||||||
| Changes in Account Receivables | ||||||||||
| Changes in Inventories | ||||||||||
| Changes in Accounts Payable | ||||||||||
| Capital Expenditure | ||||||||||
| UFCF | 336.2 | 219.2 | 121.2 | -154.0 | 144.4 | -62.0 | 30.5 | 28.4 | 26.5 | 24.7 |
| WACC, % | 11.38 | 11.38 | 11.38 | 11.38 | 11.18 | 11.34 | 11.34 | 11.34 | 11.34 | 11.34 |
| PV UFCF | ||||||||||
| SUM PV UFCF | 21.2 | |||||||||
| Long Term Growth Rate, % | 3.50 | |||||||||
| Free cash flow (T + 1) | 26 | |||||||||
| Terminal Value | 325 | |||||||||
| Present Terminal Value | 190 | |||||||||
| Enterprise Value | 211 | |||||||||
| Net Debt | -683 | |||||||||
| Equity Value | 894 | |||||||||
| Diluted Shares Outstanding, MM | 803 | |||||||||
| Equity Value Per Share | 1.11 |
Benefits You Will Receive
- Comprehensive Financial Model: Utilize Shenzhen Topway Video Communication Co., Ltd’s actual data for accurate DCF valuation.
- Complete Forecast Customization: Modify revenue growth, profit margins, WACC, and other essential factors.
- Real-Time Calculations: Instant updates allow you to view results immediately as adjustments are made.
- Professional-Grade Template: A polished Excel file crafted for high-quality valuation.
- Flexible and Reusable: Designed for adaptability, making it suitable for multiple detailed forecasts.
Key Features
- Comprehensive DCF Calculator: Features detailed unlevered and levered DCF valuation models tailored for Shenzhen Topway Video Communication Co., Ltd (002238SZ).
- WACC Calculator: Pre-configured Weighted Average Cost of Capital sheet with adjustable inputs to suit your analysis needs.
- Customizable Forecast Assumptions: Adjust growth rates, capital expenditures, and discount rates with ease.
- Integrated Financial Ratios: Evaluate profitability, leverage, and efficiency ratios specific to Shenzhen Topway Video Communication Co., Ltd (002238SZ).
- Interactive Dashboard and Charts: Visual representations summarize essential valuation metrics for straightforward analysis.
How It Functions
- Step 1: Download the Excel spreadsheet.
- Step 2: Examine the pre-filled financial information and projections for Shenzhen Topway Video Communication Co., Ltd (002238SZ).
- Step 3: Adjust key parameters such as revenue growth, WACC, and tax rates (indicated by highlighted cells).
- Step 4: Observe the DCF model update in real time as you alter your assumptions.
- Step 5: Evaluate the results and leverage the findings for your investment strategies.
Why Select This Calculator for Shenzhen Topway Video Communication Co., Ltd (002238SZ)?
- User-Friendly Interface: Tailored for both novices and seasoned professionals.
- Customizable Inputs: Adjust values easily to align with your financial analysis.
- Real-Time Valuation Updates: Instantly observe changes to Shenzhen Topway's valuation as you edit inputs.
- Preloaded Financial Data: Includes Shenzhen Topway's actual financial figures for immediate analysis.
- Preferred by Industry Experts: Trusted by investors and analysts for making well-informed choices.
Who Should Use This Product?
- Individual Investors: Gain insights to make educated decisions on buying or selling Shenzhen Topway Video Communication Co., Ltd (002238SZ) stock.
- Financial Analysts: Enhance your valuation procedures with easily accessible financial models tailored for (002238SZ).
- Consultants: Provide clients with accurate and timely valuation insights related to Shenzhen Topway Video Communication Co., Ltd (002238SZ).
- Business Owners: Learn how leading companies, such as Shenzhen Topway Video Communication Co., Ltd (002238SZ), are valued to inform your own business strategies.
- Finance Students: Acquire practical knowledge of valuation methods using real-world scenarios and data from (002238SZ).
Contents of the Template
- Operating and Balance Sheet Data: Pre-filled historical data and forecasts for Shenzhen Topway Video Communication Co., Ltd (002238SZ), including revenue, EBITDA, EBIT, and capital expenditures.
- WACC Calculation: A dedicated sheet for Weighted Average Cost of Capital (WACC), featuring parameters such as Beta, risk-free rate, and share price.
- DCF Valuation (Unlevered and Levered): Customizable Discounted Cash Flow models presenting intrinsic value with comprehensive calculations.
- Financial Statements: Pre-loaded annual and quarterly financial statements to facilitate detailed analysis.
- Key Ratios: A collection of profitability, leverage, and efficiency ratios for Shenzhen Topway Video Communication Co., Ltd (002238SZ).
- Dashboard and Charts: A visual summary of valuation outputs and assumptions to simplify result analysis.
Disclaimer
All information, articles, and product details provided on this website are for general informational and educational purposes only. We do not claim any ownership over, nor do we intend to infringe upon, any trademarks, copyrights, logos, brand names, or other intellectual property mentioned or depicted on this site. Such intellectual property remains the property of its respective owners, and any references here are made solely for identification or informational purposes, without implying any affiliation, endorsement, or partnership.
We make no representations or warranties, express or implied, regarding the accuracy, completeness, or suitability of any content or products presented. Nothing on this website should be construed as legal, tax, investment, financial, medical, or other professional advice. In addition, no part of this site—including articles or product references—constitutes a solicitation, recommendation, endorsement, advertisement, or offer to buy or sell any securities, franchises, or other financial instruments, particularly in jurisdictions where such activity would be unlawful.
All content is of a general nature and may not address the specific circumstances of any individual or entity. It is not a substitute for professional advice or services. Any actions you take based on the information provided here are strictly at your own risk. You accept full responsibility for any decisions or outcomes arising from your use of this website and agree to release us from any liability in connection with your use of, or reliance upon, the content or products found herein.