
|
Yunnan Xiyi Industry Co., Ltd. (002265.sz) Valoración de DCF |
Completamente Editable: Adáptelo A Sus Necesidades En Excel O Sheets
Diseño Profesional: Plantillas Confiables Y Estándares De La Industria
Predeterminadas Para Un Uso Rápido Y Eficiente
Compatible con MAC / PC, completamente desbloqueado
No Se Necesita Experiencia; Fáciles De Seguir
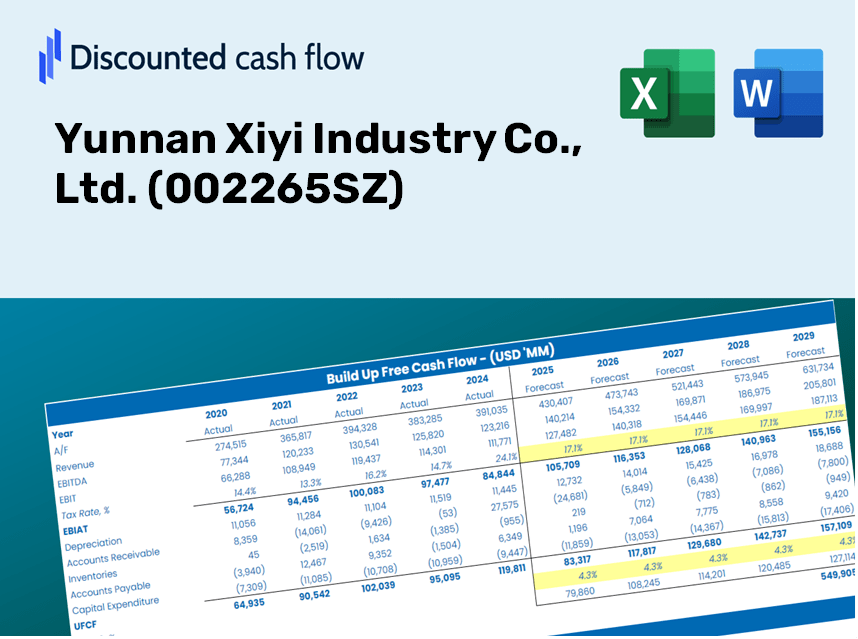
Yunnan Xiyi Industry Co., Ltd. (002265.SZ) Bundle
¿Busca evaluar el valor intrínseco de Yunnan Xiyi Industry Co., Ltd.? Nuestra calculadora DCF (002265SZ) integra datos del mundo real con extensas funciones de personalización, lo que le permite refinar sus pronósticos y tomar decisiones de inversión más informadas.
Discounted Cash Flow (DCF) - (USD MM)
| Year | AY1 2020 |
AY2 2021 |
AY3 2022 |
AY4 2023 |
AY5 2024 |
FY1 2025 |
FY2 2026 |
FY3 2027 |
FY4 2028 |
FY5 2029 |
|---|---|---|---|---|---|---|---|---|---|---|
| Revenue | 639.1 | 784.5 | 4,255.9 | 4,256.0 | 4,354.6 | 5,716.1 | 7,503.4 | 9,849.5 | 12,929.2 | 16,971.8 |
| Revenue Growth, % | 0 | 22.75 | 442.51 | 0.0017613 | 2.32 | 31.27 | 31.27 | 31.27 | 31.27 | 31.27 |
| EBITDA | 36.9 | 540.6 | 443.2 | 572.0 | 549.5 | 1,270.8 | 1,668.1 | 2,189.7 | 2,874.4 | 3,773.1 |
| EBITDA, % | 5.78 | 68.91 | 10.41 | 13.44 | 12.62 | 22.23 | 22.23 | 22.23 | 22.23 | 22.23 |
| Depreciation | 93.2 | 236.6 | 233.7 | 219.6 | 228.4 | 693.2 | 910.0 | 1,194.5 | 1,568.0 | 2,058.3 |
| Depreciation, % | 14.58 | 30.16 | 5.49 | 5.16 | 5.24 | 12.13 | 12.13 | 12.13 | 12.13 | 12.13 |
| EBIT | -56.2 | 303.9 | 209.5 | 352.4 | 321.1 | 577.6 | 758.2 | 995.2 | 1,306.4 | 1,714.9 |
| EBIT, % | -8.8 | 38.74 | 4.92 | 8.28 | 7.37 | 10.1 | 10.1 | 10.1 | 10.1 | 10.1 |
| Total Cash | 122.7 | 96.4 | 2,036.6 | 2,176.8 | 2,724.3 | 2,207.0 | 2,897.1 | 3,802.9 | 4,992.0 | 6,552.9 |
| Total Cash, percent | .0 | .0 | .0 | .0 | .0 | .0 | .0 | .0 | .0 | .0 |
| Account Receivables | 240.3 | 1,341.6 | 957.9 | 1,257.0 | 1,525.7 | 2,568.6 | 3,371.7 | 4,426.0 | 5,809.8 | 7,626.4 |
| Account Receivables, % | 37.6 | 171.02 | 22.51 | 29.54 | 35.04 | 44.94 | 44.94 | 44.94 | 44.94 | 44.94 |
| Inventories | 168.1 | 179.7 | 864.2 | 827.9 | 786.2 | 1,223.6 | 1,606.1 | 2,108.3 | 2,767.5 | 3,632.9 |
| Inventories, % | 26.3 | 22.91 | 20.31 | 19.45 | 18.05 | 21.41 | 21.41 | 21.41 | 21.41 | 21.41 |
| Accounts Payable | 200.5 | 149.3 | 2,199.4 | 1,937.2 | 2,263.4 | 2,281.6 | 2,994.9 | 3,931.4 | 5,160.6 | 6,774.2 |
| Accounts Payable, % | 31.37 | 19.03 | 51.68 | 45.52 | 51.98 | 39.91 | 39.91 | 39.91 | 39.91 | 39.91 |
| Capital Expenditure | -78.4 | -38.0 | -409.9 | -151.6 | -124.5 | -379.1 | -497.6 | -653.2 | -857.4 | -1,125.5 |
| Capital Expenditure, % | -12.26 | -4.84 | -9.63 | -3.56 | -2.86 | -6.63 | -6.63 | -6.63 | -6.63 | -6.63 |
| Tax Rate, % | 16.26 | 16.26 | 16.26 | 16.26 | 16.26 | 16.26 | 16.26 | 16.26 | 16.26 | 16.26 |
| EBITAT | -55.6 | 828.4 | 204.8 | 301.4 | 268.9 | 538.1 | 706.3 | 927.2 | 1,217.1 | 1,597.6 |
| Depreciation | ||||||||||
| Changes in Account Receivables | ||||||||||
| Changes in Inventories | ||||||||||
| Changes in Accounts Payable | ||||||||||
| Capital Expenditure | ||||||||||
| UFCF | -248.7 | -137.1 | 1,777.8 | -155.5 | 472.0 | -609.9 | 646.4 | 848.5 | 1,113.8 | 1,462.1 |
| WACC, % | 7.87 | 7.87 | 7.87 | 7.87 | 7.87 | 7.87 | 7.87 | 7.87 | 7.87 | 7.87 |
| PV UFCF | ||||||||||
| SUM PV UFCF | 2,489.6 | |||||||||
| Long Term Growth Rate, % | 3.00 | |||||||||
| Free cash flow (T + 1) | 1,506 | |||||||||
| Terminal Value | 30,907 | |||||||||
| Present Terminal Value | 21,159 | |||||||||
| Enterprise Value | 23,649 | |||||||||
| Net Debt | -2,114 | |||||||||
| Equity Value | 25,763 | |||||||||
| Diluted Shares Outstanding, MM | 1,040 | |||||||||
| Equity Value Per Share | 24.78 |
What You Will Receive
- Authentic YXI Financial Data: Pre-loaded with Yunnan Xiyi Industry's historical and forecasted data for accurate analysis.
- Customizable Template: Effortlessly adjust key metrics such as revenue growth, WACC, and EBITDA margin.
- Real-Time Calculations: Instantly view updates to Yunnan Xiyi's intrinsic value as you make modifications.
- Expert Valuation Tool: Tailored for investors, analysts, and consultants in pursuit of precise DCF outcomes.
- User-Centric Design: Streamlined layout and straightforward instructions suitable for all skill levels.
Key Features
- Pre-Loaded Data: Historical financial statements and pre-filled forecasts for Yunnan Xiyi Industry Co., Ltd. (002265SZ).
- Fully Adjustable Inputs: Customize WACC, tax rates, revenue growth, and EBITDA margins to suit your analysis.
- Instant Results: View Yunnan Xiyi's intrinsic value recalculated in real time.
- Clear Visual Outputs: Interactive dashboard charts that showcase valuation results and essential metrics.
- Built for Accuracy: A robust tool designed for analysts, investors, and finance professionals.
How It Functions
- 1. Access the Template: Download and open the Excel file containing Yunnan Xiyi Industry Co., Ltd.'s (002265SZ) preloaded data.
- 2. Adjust Key Assumptions: Modify essential inputs such as growth rates, WACC, and capital expenditures.
- 3. Instant Results Display: The DCF model automatically computes intrinsic value and NPV in real-time.
- 4. Explore Different Scenarios: Evaluate various forecasts to see how they impact valuation results.
- 5. Present with Assurance: Showcase professional valuation analysis to back your decision-making process.
Why Opt for Yunnan Xiyi Industry Co., Ltd. ([002265SZ])'s Calculator?
- Precision: Utilizes authentic Yunnan Xiyi financial data to ensure reliable results.
- Adaptability: Built for users to easily experiment with and adjust inputs as needed.
- Efficiency: Avoid the complexities of creating a DCF model from the ground up.
- Expert-Level: Crafted with the accuracy and functionality expected by top financial executives.
- Intuitive: Designed to be accessible for all users, regardless of their financial modeling expertise.
Who Can Benefit from Yunnan Xiyi Industry Co., Ltd. (002265SZ)?
- Investors: Gain insights for informed investment choices with our comprehensive analysis tools.
- Financial Analysts: Streamline your workflow with our customizable financial models.
- Consultants: Easily modify our templates to create impactful presentations or reports for clients.
- Finance Enthusiasts: Enhance your knowledge of industry trends and valuation methods through practical examples.
- Educators and Students: Utilize our resources as a hands-on educational aid in finance programs.
Contents of the Template
- Pre-Filled Data: Contains historical financial data and projections for Yunnan Xiyi Industry Co., Ltd. (002265SZ).
- Discounted Cash Flow Model: An editable DCF valuation model with automated calculations.
- Weighted Average Cost of Capital (WACC): A specific worksheet for calculating WACC using customized inputs.
- Key Financial Ratios: Assess Yunnan Xiyi's profitability, efficiency, and leverage ratios.
- Customizable Inputs: Easily modify revenue growth, profit margins, and tax rates.
- Clear Dashboard: Visuals and tables that summarize essential valuation metrics.
Disclaimer
All information, articles, and product details provided on this website are for general informational and educational purposes only. We do not claim any ownership over, nor do we intend to infringe upon, any trademarks, copyrights, logos, brand names, or other intellectual property mentioned or depicted on this site. Such intellectual property remains the property of its respective owners, and any references here are made solely for identification or informational purposes, without implying any affiliation, endorsement, or partnership.
We make no representations or warranties, express or implied, regarding the accuracy, completeness, or suitability of any content or products presented. Nothing on this website should be construed as legal, tax, investment, financial, medical, or other professional advice. In addition, no part of this site—including articles or product references—constitutes a solicitation, recommendation, endorsement, advertisement, or offer to buy or sell any securities, franchises, or other financial instruments, particularly in jurisdictions where such activity would be unlawful.
All content is of a general nature and may not address the specific circumstances of any individual or entity. It is not a substitute for professional advice or services. Any actions you take based on the information provided here are strictly at your own risk. You accept full responsibility for any decisions or outcomes arising from your use of this website and agree to release us from any liability in connection with your use of, or reliance upon, the content or products found herein.