
|
Sichuan Crun Co., Ltd (002272.sz) Valoración de DCF |
Completamente Editable: Adáptelo A Sus Necesidades En Excel O Sheets
Diseño Profesional: Plantillas Confiables Y Estándares De La Industria
Predeterminadas Para Un Uso Rápido Y Eficiente
Compatible con MAC / PC, completamente desbloqueado
No Se Necesita Experiencia; Fáciles De Seguir
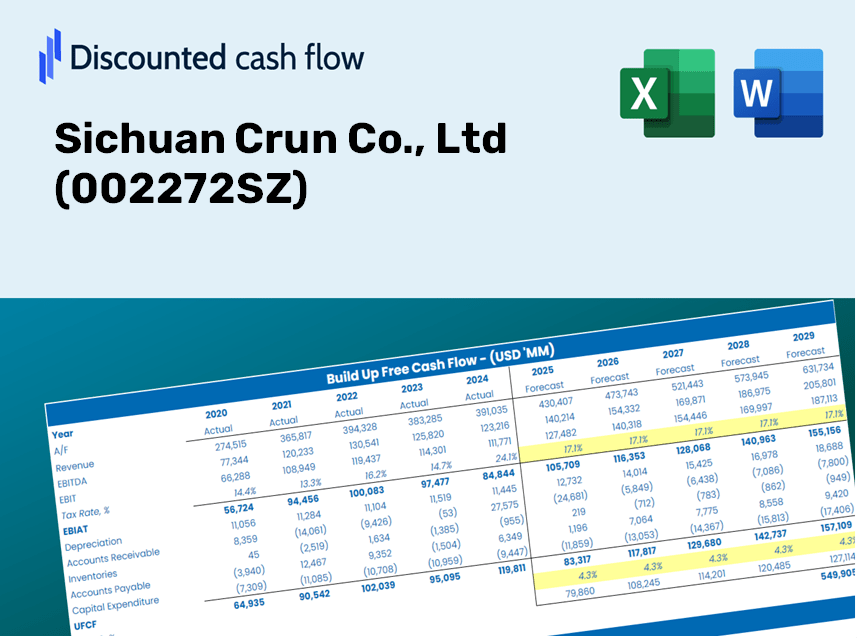
Sichuan Crun Co., Ltd (002272.SZ) Bundle
¡Optimice su tiempo y mejore la precisión con nuestra calculadora DCF (002272SZ)! Con el Real Sichuan Crun Co., los datos LTD y las suposiciones personalizables, esta herramienta le permite pronosticar, analizar y valorar Sichuan Crun Co., Ltd como un inversor experimentado.
Discounted Cash Flow (DCF) - (USD MM)
| Year | AY1 2020 |
AY2 2021 |
AY3 2022 |
AY4 2023 |
AY5 2024 |
FY1 2025 |
FY2 2026 |
FY3 2027 |
FY4 2028 |
FY5 2029 |
|---|---|---|---|---|---|---|---|---|---|---|
| Revenue | 1,273.2 | 1,531.4 | 1,698.6 | 1,663.6 | 1,596.9 | 1,697.2 | 1,803.9 | 1,917.2 | 2,037.6 | 2,165.6 |
| Revenue Growth, % | 0 | 20.28 | 10.92 | -2.06 | -4.01 | 6.28 | 6.28 | 6.28 | 6.28 | 6.28 |
| EBITDA | 133.4 | 123.7 | 71.8 | 37.3 | 16.1 | 88.4 | 93.9 | 99.8 | 106.1 | 112.7 |
| EBITDA, % | 10.48 | 8.08 | 4.23 | 2.24 | 1.01 | 5.21 | 5.21 | 5.21 | 5.21 | 5.21 |
| Depreciation | 48.0 | 59.3 | 71.3 | 70.9 | 75.8 | 70.8 | 75.2 | 79.9 | 85.0 | 90.3 |
| Depreciation, % | 3.77 | 3.87 | 4.2 | 4.26 | 4.75 | 4.17 | 4.17 | 4.17 | 4.17 | 4.17 |
| EBIT | 85.4 | 64.4 | .4 | -33.6 | -59.6 | 17.6 | 18.7 | 19.9 | 21.1 | 22.4 |
| EBIT, % | 6.7 | 4.21 | 0.02641237 | -2.02 | -3.73 | 1.04 | 1.04 | 1.04 | 1.04 | 1.04 |
| Total Cash | 180.5 | 325.3 | 176.0 | 272.9 | 304.3 | 275.8 | 293.1 | 311.5 | 331.1 | 351.9 |
| Total Cash, percent | .0 | .0 | .0 | .0 | .0 | .0 | .0 | .0 | .0 | .0 |
| Account Receivables | 889.7 | 961.8 | 1,288.4 | 1,279.8 | 1,264.6 | 1,237.8 | 1,315.6 | 1,398.2 | 1,486.0 | 1,579.4 |
| Account Receivables, % | 69.88 | 62.81 | 75.85 | 76.93 | 79.19 | 72.93 | 72.93 | 72.93 | 72.93 | 72.93 |
| Inventories | 814.2 | 398.9 | 511.7 | 439.2 | 448.9 | 592.8 | 630.0 | 669.6 | 711.7 | 756.4 |
| Inventories, % | 63.95 | 26.05 | 30.12 | 26.4 | 28.11 | 34.93 | 34.93 | 34.93 | 34.93 | 34.93 |
| Accounts Payable | 393.8 | 472.5 | 496.0 | 319.7 | 475.2 | 475.1 | 504.9 | 536.6 | 570.4 | 606.2 |
| Accounts Payable, % | 30.93 | 30.85 | 29.2 | 19.22 | 29.76 | 27.99 | 27.99 | 27.99 | 27.99 | 27.99 |
| Capital Expenditure | -22.9 | -32.8 | -40.0 | -20.5 | -41.5 | -34.4 | -36.5 | -38.8 | -41.3 | -43.9 |
| Capital Expenditure, % | -1.8 | -2.14 | -2.36 | -1.23 | -2.6 | -2.03 | -2.03 | -2.03 | -2.03 | -2.03 |
| Tax Rate, % | -2.27 | -2.27 | -2.27 | -2.27 | -2.27 | -2.27 | -2.27 | -2.27 | -2.27 | -2.27 |
| EBITAT | 67.1 | 54.8 | .7 | -31.4 | -61.0 | 16.1 | 17.1 | 18.2 | 19.3 | 20.5 |
| Depreciation | ||||||||||
| Changes in Account Receivables | ||||||||||
| Changes in Inventories | ||||||||||
| Changes in Accounts Payable | ||||||||||
| Capital Expenditure | ||||||||||
| UFCF | -1,217.9 | 503.2 | -383.8 | -76.2 | 134.2 | -64.7 | -29.4 | -31.2 | -33.2 | -35.3 |
| WACC, % | 4.61 | 4.65 | 4.72 | 4.69 | 4.72 | 4.68 | 4.68 | 4.68 | 4.68 | 4.68 |
| PV UFCF | ||||||||||
| SUM PV UFCF | -171.6 | |||||||||
| Long Term Growth Rate, % | 4.00 | |||||||||
| Free cash flow (T + 1) | -37 | |||||||||
| Terminal Value | -5,405 | |||||||||
| Present Terminal Value | -4,300 | |||||||||
| Enterprise Value | -4,472 | |||||||||
| Net Debt | 231 | |||||||||
| Equity Value | -4,703 | |||||||||
| Diluted Shares Outstanding, MM | 476 | |||||||||
| Equity Value Per Share | -9.87 |
Benefits You Will Receive
- Accurate 002272SZ Financial Data: Pre-filled with Sichuan Crun Co., Ltd's historical and projected figures for detailed analysis.
- Customizable Template: Easily adjust key inputs such as revenue growth, WACC, and EBITDA percentage.
- Instant Calculations: Watch the intrinsic value of Sichuan Crun Co., Ltd update in real-time as you make adjustments.
- Professional Valuation Resource: Tailored for investors, analysts, and consultants in need of reliable DCF results.
- Intuitive Design: Organized layout and straightforward instructions suitable for all levels of expertise.
Key Features
- Real-Time Sichuan Crun Data: Loaded with historical financial data and future projections for Sichuan Crun Co., Ltd (002272SZ).
- Completely Customizable Parameters: Modify revenue growth, profit margins, WACC, tax rates, and capital expenditures.
- Adaptive Valuation Model: Automatically recalculates Net Present Value (NPV) and intrinsic value based on user-defined inputs.
- Scenario Analysis: Develop various forecasting scenarios to evaluate differing valuation results.
- Intuitive Interface: Streamlined design tailored for both experienced professionals and newcomers.
How It Works
- Step 1: Download the Excel file for Sichuan Crun Co., Ltd (002272SZ).
- Step 2: Review the pre-filled data for Sichuan Crun (historical and projected).
- Step 3: Update the key assumptions (yellow cells) according to your analysis.
- Step 4: Observe automatic recalculations for Sichuan Crun's intrinsic value.
- Step 5: Utilize the outputs for investment decisions or reporting purposes.
Why Choose the Sichuan Crun Co., Ltd (002272SZ) Financial Calculator?
- Accuracy: Leverages real Sichuan Crun financial data for precise calculations.
- Flexibility: Allows users to experiment and adjust inputs with ease.
- Time-Saving: Eliminate the complexities of creating a DCF model from the ground up.
- Professional-Grade: Crafted with a focus on exactness and usability for finance professionals.
- User-Friendly: Intuitive design makes it accessible for users without extensive financial modeling skills.
Who Can Benefit from This Product?
- Investors: Assess Sichuan Crun Co., Ltd’s (002272SZ) valuation prior to making investment decisions.
- CFOs and Financial Analysts: Optimize valuation methodologies and evaluate financial forecasts.
- Startup Founders: Gain insights into the valuation practices of prominent public companies like Sichuan Crun Co., Ltd (002272SZ).
- Consultants: Provide expert valuation analysis and reports to clients.
- Students and Educators: Apply real market data to learn and teach important valuation strategies.
Contents of the Template
- Operating and Balance Sheet Data: Pre-filled historical data and forecasts for Sichuan Crun Co., Ltd (002272SZ), including revenue, EBITDA, EBIT, and capital expenditures.
- WACC Calculation: A dedicated sheet for the Weighted Average Cost of Capital (WACC), featuring key parameters such as Beta, risk-free rate, and share price.
- DCF Valuation (Unlevered and Levered): Customizable Discounted Cash Flow models that present intrinsic value along with comprehensive calculations.
- Financial Statements: Pre-loaded annual and quarterly financial statements to facilitate in-depth analysis.
- Key Ratios: A collection of profitability, leverage, and efficiency ratios specifically for Sichuan Crun Co., Ltd (002272SZ).
- Dashboard and Charts: A visual summary of valuation outputs and underlying assumptions for easy analysis of results.
Disclaimer
All information, articles, and product details provided on this website are for general informational and educational purposes only. We do not claim any ownership over, nor do we intend to infringe upon, any trademarks, copyrights, logos, brand names, or other intellectual property mentioned or depicted on this site. Such intellectual property remains the property of its respective owners, and any references here are made solely for identification or informational purposes, without implying any affiliation, endorsement, or partnership.
We make no representations or warranties, express or implied, regarding the accuracy, completeness, or suitability of any content or products presented. Nothing on this website should be construed as legal, tax, investment, financial, medical, or other professional advice. In addition, no part of this site—including articles or product references—constitutes a solicitation, recommendation, endorsement, advertisement, or offer to buy or sell any securities, franchises, or other financial instruments, particularly in jurisdictions where such activity would be unlawful.
All content is of a general nature and may not address the specific circumstances of any individual or entity. It is not a substitute for professional advice or services. Any actions you take based on the information provided here are strictly at your own risk. You accept full responsibility for any decisions or outcomes arising from your use of this website and agree to release us from any liability in connection with your use of, or reliance upon, the content or products found herein.