
|
Zhejiang Crystal-Optech Co., Ltd (002273.sz) Valoración de DCF |
Completamente Editable: Adáptelo A Sus Necesidades En Excel O Sheets
Diseño Profesional: Plantillas Confiables Y Estándares De La Industria
Predeterminadas Para Un Uso Rápido Y Eficiente
Compatible con MAC / PC, completamente desbloqueado
No Se Necesita Experiencia; Fáciles De Seguir
Zhejiang Crystal-Optech Co., Ltd (002273.SZ) Bundle
¡Obtenga información sobre su análisis de valoración de Zhejiang Crystal-Optech Co., LTD (002273SZ) con nuestra sofisticada calculadora DCF! Antes de datos reales (002273SZ), esta plantilla de Excel le permite ajustar preventos y supuestos para determinar con precisión el valor intrínseco de Zhejiang Crystal-Optech Co., Ltd.
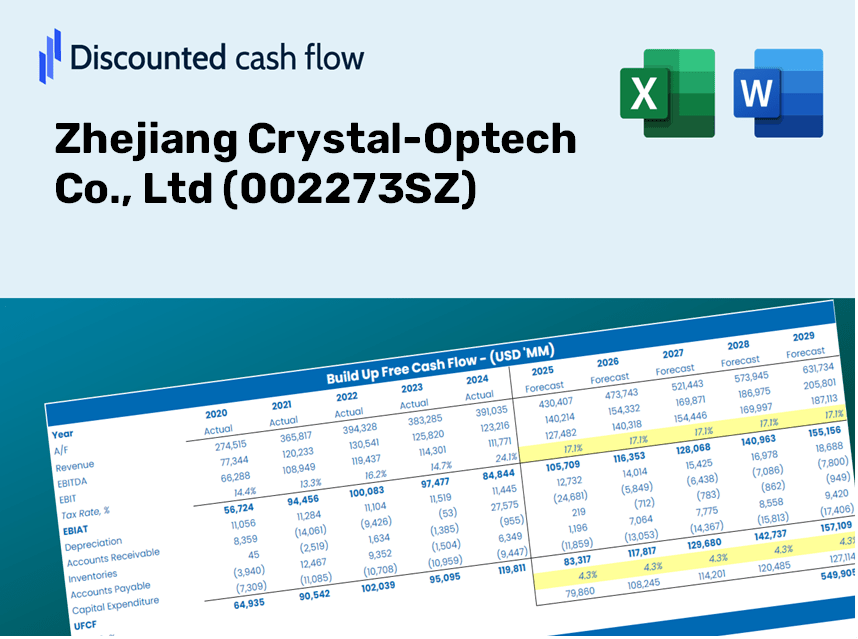
Discounted Cash Flow (DCF) - (USD MM)
| Year | AY1 2020 |
AY2 2021 |
AY3 2022 |
AY4 2023 |
AY5 2024 |
FY1 2025 |
FY2 2026 |
FY3 2027 |
FY4 2028 |
FY5 2029 |
|---|---|---|---|---|---|---|---|---|---|---|
| Revenue | 3,223.4 | 3,809.4 | 4,375.5 | 5,076.2 | 6,277.7 | 7,419.0 | 8,767.8 | 10,361.9 | 12,245.7 | 14,472.1 |
| Revenue Growth, % | 0 | 18.18 | 14.86 | 16.01 | 23.67 | 18.18 | 18.18 | 18.18 | 18.18 | 18.18 |
| EBITDA | 768.8 | 815.0 | 936.3 | 1,067.9 | 1,679.2 | 1,697.9 | 2,006.6 | 2,371.4 | 2,802.6 | 3,312.1 |
| EBITDA, % | 23.85 | 21.4 | 21.4 | 21.04 | 26.75 | 22.89 | 22.89 | 22.89 | 22.89 | 22.89 |
| Depreciation | 269.8 | 320.6 | 366.7 | 422.2 | 500.9 | 615.2 | 727.0 | 859.2 | 1,015.4 | 1,200.1 |
| Depreciation, % | 8.37 | 8.42 | 8.38 | 8.32 | 7.98 | 8.29 | 8.29 | 8.29 | 8.29 | 8.29 |
| EBIT | 499.0 | 494.5 | 569.7 | 645.7 | 1,178.3 | 1,082.7 | 1,279.6 | 1,512.2 | 1,787.1 | 2,112.0 |
| EBIT, % | 15.48 | 12.98 | 13.02 | 12.72 | 18.77 | 14.59 | 14.59 | 14.59 | 14.59 | 14.59 |
| Total Cash | 1,514.7 | 3,203.1 | 2,530.3 | 2,420.8 | 2,162.0 | 4,021.6 | 4,752.8 | 5,616.8 | 6,638.0 | 7,844.8 |
| Total Cash, percent | .0 | .0 | .0 | .0 | .0 | .0 | .0 | .0 | .0 | .0 |
| Account Receivables | 1,141.7 | 939.6 | 958.9 | 1,305.5 | 1,205.6 | 1,883.3 | 2,225.7 | 2,630.3 | 3,108.5 | 3,673.6 |
| Account Receivables, % | 35.42 | 24.67 | 21.91 | 25.72 | 19.2 | 25.38 | 25.38 | 25.38 | 25.38 | 25.38 |
| Inventories | 489.7 | 550.0 | 700.5 | 718.8 | 784.6 | 1,072.7 | 1,267.7 | 1,498.2 | 1,770.6 | 2,092.5 |
| Inventories, % | 15.19 | 14.44 | 16.01 | 14.16 | 12.5 | 14.46 | 14.46 | 14.46 | 14.46 | 14.46 |
| Accounts Payable | 1,102.0 | 1,054.4 | 1,289.9 | 1,781.4 | 1,677.2 | 2,272.5 | 2,685.7 | 3,173.9 | 3,751.0 | 4,432.9 |
| Accounts Payable, % | 34.19 | 27.68 | 29.48 | 35.09 | 26.72 | 30.63 | 30.63 | 30.63 | 30.63 | 30.63 |
| Capital Expenditure | -567.3 | -903.7 | -982.9 | -1,105.6 | -924.3 | -1,488.1 | -1,758.7 | -2,078.4 | -2,456.3 | -2,902.8 |
| Capital Expenditure, % | -17.6 | -23.72 | -22.46 | -21.78 | -14.72 | -20.06 | -20.06 | -20.06 | -20.06 | -20.06 |
| Tax Rate, % | 12.46 | 12.46 | 12.46 | 12.46 | 12.46 | 12.46 | 12.46 | 12.46 | 12.46 | 12.46 |
| EBITAT | 432.2 | 440.3 | 533.5 | 582.2 | 1,031.4 | 968.0 | 1,144.0 | 1,352.0 | 1,597.8 | 1,888.3 |
| Depreciation | ||||||||||
| Changes in Account Receivables | ||||||||||
| Changes in Inventories | ||||||||||
| Changes in Accounts Payable | ||||||||||
| Capital Expenditure | ||||||||||
| UFCF | -394.7 | -48.6 | -16.9 | 25.3 | 537.9 | -275.3 | -11.9 | -14.0 | -16.6 | -19.6 |
| WACC, % | 5.43 | 5.43 | 5.43 | 5.43 | 5.43 | 5.43 | 5.43 | 5.43 | 5.43 | 5.43 |
| PV UFCF | ||||||||||
| SUM PV UFCF | -312.2 | |||||||||
| Long Term Growth Rate, % | 3.50 | |||||||||
| Free cash flow (T + 1) | -20 | |||||||||
| Terminal Value | -1,051 | |||||||||
| Present Terminal Value | -807 | |||||||||
| Enterprise Value | -1,119 | |||||||||
| Net Debt | -1,963 | |||||||||
| Equity Value | 844 | |||||||||
| Diluted Shares Outstanding, MM | 1,375 | |||||||||
| Equity Value Per Share | 0.61 |
What You Will Receive
- Customizable Excel Template: An adaptable Excel-based DCF Calculator featuring pre-filled financial data for Zhejiang Crystal-Optech Co., Ltd (002273SZ).
- Accurate Data: Access to historical figures and projected estimates (highlighted in the designated cells).
- Flexible Forecasting: Easily modify forecast parameters such as revenue growth, EBITDA percentage, and WACC.
- Instant Calculations: Quickly visualize how your adjustments affect the valuation of Zhejiang Crystal-Optech Co., Ltd (002273SZ).
- Professional Resource: Designed for investors, CFOs, consultants, and financial analysts.
- Intuitive Layout: Organized for straightforward navigation and usability, complete with step-by-step guidance.
Key Features
- Comprehensive DCF Calculator: Offers in-depth unlevered and levered DCF valuation frameworks tailored for Zhejiang Crystal-Optech Co., Ltd (002273SZ).
- WACC Calculator: Features a pre-configured Weighted Average Cost of Capital sheet with adjustable parameters.
- Customizable Forecast Assumptions: Easily alter growth rates, capital expenditures, and discount rates as needed.
- Integrated Financial Ratios: Evaluate profitability, leverage, and efficiency metrics specific to Zhejiang Crystal-Optech Co., Ltd (002273SZ).
- Interactive Dashboard and Charts: Visual representations provide a clear overview of essential valuation metrics for streamlined analysis.
How It Functions
- Step 1: Download the Excel file.
- Step 2: Examine the pre-filled data for Zhejiang Crystal-Optech Co., Ltd (002273SZ).
- Step 3: Modify the key assumptions (highlighted in yellow) according to your analysis.
- Step 4: Observe the automatic updates for the intrinsic value of Zhejiang Crystal-Optech Co., Ltd (002273SZ).
- Step 5: Utilize the results for your investment decisions or reporting purposes.
Reasons to Select This Calculator for Zhejiang Crystal-Optech Co., Ltd (002273SZ)
- All-in-One Solution: Combines DCF, WACC, and financial ratio analyses for streamlined evaluation.
- Flexible Inputs: Modify the highlighted cells to explore different financial scenarios.
- In-Depth Analysis: Automatically computes the intrinsic value and Net Present Value for Zhejiang Crystal-Optech.
- Built-In Data: Access historical and anticipated data for reliable starting points in your analysis.
- High-Quality Standards: Tailored for financial analysts, investors, and business consultants working with Zhejiang Crystal-Optech Co., Ltd (002273SZ).
Who Could Benefit from This Product?
- Investors: Evaluate Zhejiang Crystal-Optech Co., Ltd’s valuation before making stock transactions.
- CFOs and Financial Analysts: Optimize valuation procedures and validate financial forecasts.
- Startup Founders: Gain insights into how large public entities like Zhejiang Crystal-Optech Co., Ltd (002273SZ) are appraised.
- Consultants: Provide comprehensive valuation reports for your clients.
- Students and Educators: Utilize real-world examples to learn and teach valuation methods.
Contents of the Template
- Pre-Filled DCF Model: Zhejiang Crystal-Optech Co., Ltd's (002273SZ) financial data preloaded for immediate analysis.
- WACC Calculator: Comprehensive calculations for the Weighted Average Cost of Capital.
- Financial Ratios: Assess profitability, leverage, and efficiency for Zhejiang Crystal-Optech Co., Ltd (002273SZ).
- Editable Inputs: Modify assumptions such as growth rates, margins, and CAPEX to suit your analysis.
- Financial Statements: Access annual and quarterly reports for thorough evaluation.
- Interactive Dashboard: Visualize essential valuation metrics and outcomes effortlessly.
Disclaimer
All information, articles, and product details provided on this website are for general informational and educational purposes only. We do not claim any ownership over, nor do we intend to infringe upon, any trademarks, copyrights, logos, brand names, or other intellectual property mentioned or depicted on this site. Such intellectual property remains the property of its respective owners, and any references here are made solely for identification or informational purposes, without implying any affiliation, endorsement, or partnership.
We make no representations or warranties, express or implied, regarding the accuracy, completeness, or suitability of any content or products presented. Nothing on this website should be construed as legal, tax, investment, financial, medical, or other professional advice. In addition, no part of this site—including articles or product references—constitutes a solicitation, recommendation, endorsement, advertisement, or offer to buy or sell any securities, franchises, or other financial instruments, particularly in jurisdictions where such activity would be unlawful.
All content is of a general nature and may not address the specific circumstances of any individual or entity. It is not a substitute for professional advice or services. Any actions you take based on the information provided here are strictly at your own risk. You accept full responsibility for any decisions or outcomes arising from your use of this website and agree to release us from any liability in connection with your use of, or reliance upon, the content or products found herein.