
|
Valoración de DCF Group Alpha (002292.sz) |
Completamente Editable: Adáptelo A Sus Necesidades En Excel O Sheets
Diseño Profesional: Plantillas Confiables Y Estándares De La Industria
Predeterminadas Para Un Uso Rápido Y Eficiente
Compatible con MAC / PC, completamente desbloqueado
No Se Necesita Experiencia; Fáciles De Seguir
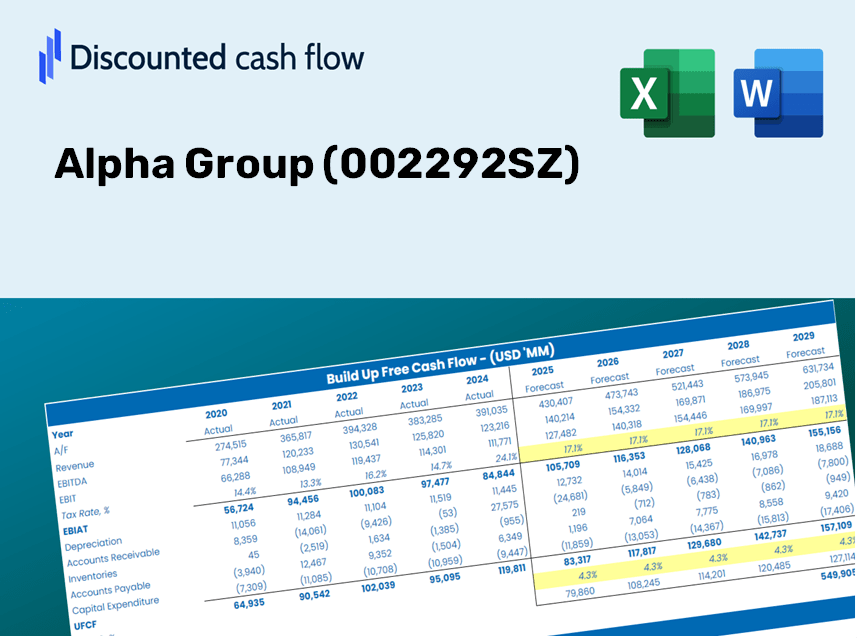
Alpha Group (002292.SZ) Bundle
Ingementada para la precisión, nuestra calculadora DCF del Grupo Alpha (002292SZ) le permite evaluar la valoración de Alpha Group utilizando datos financieros del mundo real, ofreciendo una flexibilidad completa para modificar todos los parámetros clave para mejorar las proyecciones.
Discounted Cash Flow (DCF) - (USD MM)
| Year | AY1 2020 |
AY2 2021 |
AY3 2022 |
AY4 2023 |
AY5 2024 |
FY1 2025 |
FY2 2026 |
FY3 2027 |
FY4 2028 |
FY5 2029 |
|---|---|---|---|---|---|---|---|---|---|---|
| Revenue | 2,368.2 | 2,644.3 | 2,656.8 | 2,738.8 | 2,715.3 | 2,812.8 | 2,913.8 | 3,018.4 | 3,126.7 | 3,239.0 |
| Revenue Growth, % | 0 | 11.66 | 0.47038 | 3.09 | -0.85635 | 3.59 | 3.59 | 3.59 | 3.59 | 3.59 |
| EBITDA | -123.6 | -308.6 | -99.1 | 150.0 | 149.0 | -54.3 | -56.3 | -58.3 | -60.4 | -62.6 |
| EBITDA, % | -5.22 | -11.67 | -3.73 | 5.48 | 5.49 | -1.93 | -1.93 | -1.93 | -1.93 | -1.93 |
| Depreciation | 90.2 | 74.4 | 54.6 | 53.3 | 38.7 | 67.8 | 70.2 | 72.7 | 75.3 | 78.0 |
| Depreciation, % | 3.81 | 2.81 | 2.06 | 1.94 | 1.43 | 2.41 | 2.41 | 2.41 | 2.41 | 2.41 |
| EBIT | -213.7 | -383.0 | -153.8 | 96.7 | 110.2 | -122.1 | -126.5 | -131.0 | -135.7 | -140.6 |
| EBIT, % | -9.03 | -14.48 | -5.79 | 3.53 | 4.06 | -4.34 | -4.34 | -4.34 | -4.34 | -4.34 |
| Total Cash | 576.2 | 916.6 | 831.2 | 586.0 | 567.6 | 745.8 | 772.6 | 800.4 | 829.1 | 858.9 |
| Total Cash, percent | .0 | .0 | .0 | .0 | .0 | .0 | .0 | .0 | .0 | .0 |
| Account Receivables | 449.0 | 691.4 | 415.2 | 455.1 | 505.4 | 539.8 | 559.2 | 579.3 | 600.1 | 621.6 |
| Account Receivables, % | 18.96 | 26.14 | 15.63 | 16.62 | 18.61 | 19.19 | 19.19 | 19.19 | 19.19 | 19.19 |
| Inventories | 877.8 | 767.0 | 819.0 | 640.5 | 583.1 | 797.5 | 826.1 | 855.8 | 886.5 | 918.3 |
| Inventories, % | 37.07 | 29.01 | 30.83 | 23.39 | 21.47 | 28.35 | 28.35 | 28.35 | 28.35 | 28.35 |
| Accounts Payable | 470.7 | 494.1 | 579.6 | 405.9 | 365.9 | 498.8 | 516.7 | 535.3 | 554.5 | 574.4 |
| Accounts Payable, % | 19.88 | 18.69 | 21.81 | 14.82 | 13.48 | 17.73 | 17.73 | 17.73 | 17.73 | 17.73 |
| Capital Expenditure | -83.7 | -90.7 | -88.5 | -44.2 | -33.1 | -73.9 | -76.5 | -79.3 | -82.1 | -85.0 |
| Capital Expenditure, % | -3.54 | -3.43 | -3.33 | -1.61 | -1.22 | -2.63 | -2.63 | -2.63 | -2.63 | -2.63 |
| Tax Rate, % | -8.4 | -8.4 | -8.4 | -8.4 | -8.4 | -8.4 | -8.4 | -8.4 | -8.4 | -8.4 |
| EBITAT | -208.7 | -348.5 | -149.0 | 95.6 | 119.5 | -118.3 | -122.5 | -126.9 | -131.5 | -136.2 |
| Depreciation | ||||||||||
| Changes in Account Receivables | ||||||||||
| Changes in Inventories | ||||||||||
| Changes in Accounts Payable | ||||||||||
| Capital Expenditure | ||||||||||
| UFCF | -1,058.4 | -473.0 | 126.8 | 69.7 | 92.2 | -240.3 | -158.9 | -164.7 | -170.6 | -176.7 |
| WACC, % | 7.75 | 7.73 | 7.74 | 7.75 | 7.75 | 7.74 | 7.74 | 7.74 | 7.74 | 7.74 |
| PV UFCF | ||||||||||
| SUM PV UFCF | -739.8 | |||||||||
| Long Term Growth Rate, % | 4.00 | |||||||||
| Free cash flow (T + 1) | -184 | |||||||||
| Terminal Value | -4,908 | |||||||||
| Present Terminal Value | -3,380 | |||||||||
| Enterprise Value | -4,120 | |||||||||
| Net Debt | 127 | |||||||||
| Equity Value | -4,246 | |||||||||
| Diluted Shares Outstanding, MM | 1,502 | |||||||||
| Equity Value Per Share | -2.83 |
What You Will Receive
- Authentic Alpha Group Financial Data: Comes pre-populated with Alpha Group’s historical and forecasted figures for accurate analysis.
- Completely Customizable Template: Easily adjust key metrics such as revenue growth, WACC, and EBITDA %.
- Instantaneous Calculations: Watch Alpha Group’s intrinsic value refresh in real-time based on your input changes.
- Expert Valuation Tool: Tailored for investors, analysts, and consultants in pursuit of reliable DCF outcomes.
- Intuitive Layout: Streamlined structure and straightforward guidance suitable for all skill levels.
Key Features
- Comprehensive DCF Calculator: Features both unlevered and levered DCF valuation models for in-depth analysis.
- Customized WACC Calculator: Ready-to-use Weighted Average Cost of Capital sheet with adjustable parameters.
- Flexible Forecast Assumptions: Easily change growth rates, capital expenditures, and discount rates as needed.
- Integrated Financial Ratios: Evaluate profitability, leverage, and efficiency ratios specifically for Alpha Group (002292SZ).
- Interactive Dashboard and Charts: Visual representations of key valuation metrics to facilitate straightforward analysis.
How It Functions
- Download: Obtain the pre-prepared Excel file containing Alpha Group’s (002292SZ) financial data.
- Customize: Modify forecasts such as revenue growth, EBITDA margin, and WACC.
- Real-Time Updates: The intrinsic value and NPV calculations refresh automatically.
- Scenario Testing: Generate various projections and quickly compare the results.
- Informed Decisions: Leverage the valuation outcomes to shape your investment strategy.
Why Select This Calculator for Alpha Group (002292SZ)?
- Reliable Data: Accurate financial metrics for Alpha Group ensure trustworthy valuation outcomes.
- Tailorable: Modify essential factors such as growth rates, WACC, and tax rates to align with your forecasts.
- Time-Efficient: Preconfigured calculations save you the hassle of building from the ground up.
- Professional-Quality Tool: Crafted for investors, analysts, and consultants alike.
- Easy to Use: Streamlined design and clear instructions allow for effortless navigation for all users.
Who Can Benefit from This Product?
- Finance Students: Master valuation strategies and apply them to real-world scenarios.
- Academics: Integrate professional valuation frameworks into your teaching and research efforts.
- Investors: Validate your theories and assess valuation results for Alpha Group (002292SZ).
- Analysts: Enhance your efficiency with a customizable, ready-to-use DCF model.
- Small Business Owners: Discover how major publicly traded companies, like Alpha Group (002292SZ), are evaluated.
What the Template Includes
- Historical Data: Contains Alpha Group's past financial performance and foundational forecasts.
- DCF and Levered DCF Models: Comprehensive templates to assess Alpha Group's intrinsic value.
- WACC Sheet: Pre-configured calculations for the Weighted Average Cost of Capital.
- Editable Inputs: Adjust key metrics such as growth rates, EBITDA percentages, and CAPEX assumptions.
- Quarterly and Annual Statements: Detailed analysis of Alpha Group's financial statements.
- Interactive Dashboard: Dynamically visualize valuation outcomes and forecasts.
Disclaimer
All information, articles, and product details provided on this website are for general informational and educational purposes only. We do not claim any ownership over, nor do we intend to infringe upon, any trademarks, copyrights, logos, brand names, or other intellectual property mentioned or depicted on this site. Such intellectual property remains the property of its respective owners, and any references here are made solely for identification or informational purposes, without implying any affiliation, endorsement, or partnership.
We make no representations or warranties, express or implied, regarding the accuracy, completeness, or suitability of any content or products presented. Nothing on this website should be construed as legal, tax, investment, financial, medical, or other professional advice. In addition, no part of this site—including articles or product references—constitutes a solicitation, recommendation, endorsement, advertisement, or offer to buy or sell any securities, franchises, or other financial instruments, particularly in jurisdictions where such activity would be unlawful.
All content is of a general nature and may not address the specific circumstances of any individual or entity. It is not a substitute for professional advice or services. Any actions you take based on the information provided here are strictly at your own risk. You accept full responsibility for any decisions or outcomes arising from your use of this website and agree to release us from any liability in connection with your use of, or reliance upon, the content or products found herein.