
|
Shenzhen Salubris Pharmaceuticals Co., Ltd. (002294.sz) Valoración de DCF |
Completamente Editable: Adáptelo A Sus Necesidades En Excel O Sheets
Diseño Profesional: Plantillas Confiables Y Estándares De La Industria
Predeterminadas Para Un Uso Rápido Y Eficiente
Compatible con MAC / PC, completamente desbloqueado
No Se Necesita Experiencia; Fáciles De Seguir
Shenzhen Salubris Pharmaceuticals Co., Ltd. (002294.SZ) Bundle
¡Mejore su estrategia de inversión con la calculadora DCF (002294SZ)! Utilice datos financieros auténticos de Shenzhen Salubris Pharmaceuticals, ajuste las proyecciones y gastos de crecimiento, y observe instantáneamente cómo estas alteraciones afectan el valor intrínseco de la empresa.
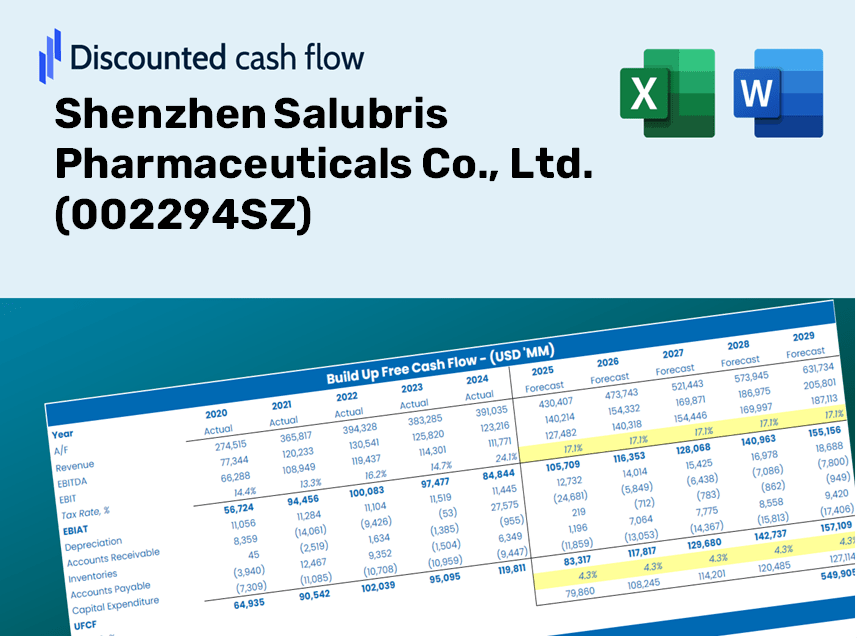
Discounted Cash Flow (DCF) - (USD MM)
| Year | AY1 2020 |
AY2 2021 |
AY3 2022 |
AY4 2023 |
AY5 2024 |
FY1 2025 |
FY2 2026 |
FY3 2027 |
FY4 2028 |
FY5 2029 |
|---|---|---|---|---|---|---|---|---|---|---|
| Revenue | 2,738.6 | 3,058.4 | 3,482.0 | 3,365.3 | 4,012.2 | 4,427.5 | 4,885.8 | 5,391.5 | 5,949.5 | 6,565.3 |
| Revenue Growth, % | 0 | 11.68 | 13.85 | -3.35 | 19.22 | 10.35 | 10.35 | 10.35 | 10.35 | 10.35 |
| EBITDA | 377.1 | 914.6 | 1,046.4 | 1,050.5 | 1,024.9 | 1,155.5 | 1,275.1 | 1,407.1 | 1,552.7 | 1,713.4 |
| EBITDA, % | 13.77 | 29.91 | 30.05 | 31.22 | 25.54 | 26.1 | 26.1 | 26.1 | 26.1 | 26.1 |
| Depreciation | 263.9 | 324.4 | 349.0 | 375.4 | 376.2 | 449.9 | 496.4 | 547.8 | 604.5 | 667.1 |
| Depreciation, % | 9.64 | 10.61 | 10.02 | 11.16 | 9.38 | 10.16 | 10.16 | 10.16 | 10.16 | 10.16 |
| EBIT | 113.2 | 590.2 | 697.4 | 675.1 | 648.7 | 705.6 | 778.7 | 859.3 | 948.2 | 1,046.3 |
| EBIT, % | 4.13 | 19.3 | 20.03 | 20.06 | 16.17 | 15.94 | 15.94 | 15.94 | 15.94 | 15.94 |
| Total Cash | 1,079.7 | 3,295.9 | 2,998.8 | 2,203.5 | 1,859.3 | 2,987.4 | 3,296.6 | 3,637.8 | 4,014.3 | 4,429.8 |
| Total Cash, percent | .0 | .0 | .0 | .0 | .0 | .0 | .0 | .0 | .0 | .0 |
| Account Receivables | 555.0 | 629.5 | 557.7 | 545.4 | 589.7 | 777.2 | 857.7 | 946.4 | 1,044.4 | 1,152.5 |
| Account Receivables, % | 20.27 | 20.58 | 16.02 | 16.21 | 14.7 | 17.55 | 17.55 | 17.55 | 17.55 | 17.55 |
| Inventories | 391.6 | 420.5 | 543.5 | 490.9 | 506.8 | 627.6 | 692.5 | 764.2 | 843.3 | 930.6 |
| Inventories, % | 14.3 | 13.75 | 15.61 | 14.59 | 12.63 | 14.17 | 14.17 | 14.17 | 14.17 | 14.17 |
| Accounts Payable | 223.4 | 187.7 | 219.6 | 156.0 | 126.1 | 251.3 | 277.3 | 306.0 | 337.7 | 372.6 |
| Accounts Payable, % | 8.16 | 6.14 | 6.31 | 4.64 | 3.14 | 5.68 | 5.68 | 5.68 | 5.68 | 5.68 |
| Capital Expenditure | -642.5 | -482.5 | -599.0 | -671.0 | -624.8 | -814.2 | -898.5 | -991.5 | -1,094.1 | -1,207.3 |
| Capital Expenditure, % | -23.46 | -15.78 | -17.2 | -19.94 | -15.57 | -18.39 | -18.39 | -18.39 | -18.39 | -18.39 |
| Tax Rate, % | 4.89 | 4.89 | 4.89 | 4.89 | 4.89 | 4.89 | 4.89 | 4.89 | 4.89 | 4.89 |
| EBITAT | 121.4 | 525.2 | 622.5 | 610.2 | 617.0 | 654.4 | 722.2 | 796.9 | 879.4 | 970.4 |
| Depreciation | ||||||||||
| Changes in Account Receivables | ||||||||||
| Changes in Inventories | ||||||||||
| Changes in Accounts Payable | ||||||||||
| Capital Expenditure | ||||||||||
| UFCF | -980.3 | 228.0 | 353.3 | 316.0 | 278.2 | 107.0 | 200.7 | 221.5 | 244.4 | 269.7 |
| WACC, % | 6.18 | 6.17 | 6.17 | 6.17 | 6.17 | 6.17 | 6.17 | 6.17 | 6.17 | 6.17 |
| PV UFCF | ||||||||||
| SUM PV UFCF | 856.2 | |||||||||
| Long Term Growth Rate, % | 4.00 | |||||||||
| Free cash flow (T + 1) | 281 | |||||||||
| Terminal Value | 12,908 | |||||||||
| Present Terminal Value | 9,567 | |||||||||
| Enterprise Value | 10,423 | |||||||||
| Net Debt | -1,001 | |||||||||
| Equity Value | 11,425 | |||||||||
| Diluted Shares Outstanding, MM | 1,114 | |||||||||
| Equity Value Per Share | 10.26 |
What You Will Receive
- Genuine Salubris Data: Comprehensive financials – encompassing revenue to EBIT – derived from actual and forecasted figures.
- Complete Customization: Modify essential parameters (yellow cells) such as WACC, growth rates, and tax percentages.
- Immediate Valuation Adjustments: Automatic recalculations to evaluate the effects of changes on Salubris's fair value.
- Flexible Excel Template: Designed for quick modifications, scenario analysis, and in-depth projections.
- Efficient and Accurate: Avoid building models from scratch while ensuring accuracy and adaptability.
Key Features
- Comprehensive DCF Calculator: Features detailed unlevered and levered DCF valuation models tailored for Shenzhen Salubris Pharmaceuticals Co., Ltd. (002294SZ).
- WACC Calculator: Ready-to-use Weighted Average Cost of Capital sheet with customizable parameters to fit your analysis needs.
- Customizable Forecast Assumptions: Adjust key variables such as growth rates, capital expenditures, and discount rates as required.
- Integrated Financial Ratios: Evaluate profitability, leverage, and efficiency metrics specifically for Shenzhen Salubris Pharmaceuticals Co., Ltd. (002294SZ).
- Visual Dashboard and Charts: Engaging visual presentations that encapsulate essential valuation metrics for straightforward analysis.
How It Functions
- 1. Access the Template: Download and open the Excel file featuring Salubris Pharmaceuticals' preloaded data.
- 2. Modify Assumptions: Adjust key variables such as growth rates, WACC, and capital expenditures.
- 3. See Results Instantly: The DCF model automatically computes intrinsic value and NPV in real time.
- 4. Explore Scenarios: Evaluate various forecasts to understand different valuation possibilities.
- 5. Utilize with Assurance: Deliver professional valuation insights to bolster your decision-making process.
Why Opt for This Financial Calculator?
- All-in-One Solution: Incorporates DCF, WACC, and financial ratios for comprehensive analysis.
- Flexible Input Fields: Modify cells highlighted in yellow to explore different financial scenarios.
- In-Depth Analysis: Automatically computes the intrinsic value and Net Present Value for Shenzhen Salubris Pharmaceuticals (002294SZ).
- Preloaded Information: Historical and projected data provide a reliable foundation for your assessments.
- High-Quality Standards: Perfect for financial analysts, investors, and business consultants focused on pharmaceutical markets.
Who Can Benefit from This Product?
- Healthcare Investors: Create comprehensive and trustworthy valuation models for analyzing portfolios focused on pharmaceuticals.
- Corporate Finance Teams: Evaluate valuation scenarios to shape strategic decisions within the organization.
- Consultants and Advisors: Offer clients precise valuation insights for Shenzhen Salubris Pharmaceuticals (002294SZ).
- Students and Educators: Utilize real-world data to learn and teach financial modeling techniques.
- Pharmaceutical Enthusiasts: Gain insights into the market valuation of biotech and pharmaceutical companies like Shenzhen Salubris Pharmaceuticals.
Contents of the Template
- Pre-Filled Data: Contains Shenzhen Salubris Pharmaceuticals' historical financials and projections.
- Discounted Cash Flow Model: Editable DCF valuation model with automated calculations.
- Weighted Average Cost of Capital (WACC): A dedicated sheet for calculating WACC using custom inputs.
- Key Financial Ratios: Evaluate Shenzhen Salubris Pharmaceuticals' profitability, efficiency, and financial leverage.
- Customizable Inputs: Easily modify revenue growth rates, profit margins, and tax rates.
- Clear Dashboard: Visuals and tables summarizing essential valuation outcomes.
Disclaimer
All information, articles, and product details provided on this website are for general informational and educational purposes only. We do not claim any ownership over, nor do we intend to infringe upon, any trademarks, copyrights, logos, brand names, or other intellectual property mentioned or depicted on this site. Such intellectual property remains the property of its respective owners, and any references here are made solely for identification or informational purposes, without implying any affiliation, endorsement, or partnership.
We make no representations or warranties, express or implied, regarding the accuracy, completeness, or suitability of any content or products presented. Nothing on this website should be construed as legal, tax, investment, financial, medical, or other professional advice. In addition, no part of this site—including articles or product references—constitutes a solicitation, recommendation, endorsement, advertisement, or offer to buy or sell any securities, franchises, or other financial instruments, particularly in jurisdictions where such activity would be unlawful.
All content is of a general nature and may not address the specific circumstances of any individual or entity. It is not a substitute for professional advice or services. Any actions you take based on the information provided here are strictly at your own risk. You accept full responsibility for any decisions or outcomes arising from your use of this website and agree to release us from any liability in connection with your use of, or reliance upon, the content or products found herein.