
|
Changchun Up Optotech Co., Ltd. (002338.sz) Valoración de DCF |
Completamente Editable: Adáptelo A Sus Necesidades En Excel O Sheets
Diseño Profesional: Plantillas Confiables Y Estándares De La Industria
Predeterminadas Para Un Uso Rápido Y Eficiente
Compatible con MAC / PC, completamente desbloqueado
No Se Necesita Experiencia; Fáciles De Seguir
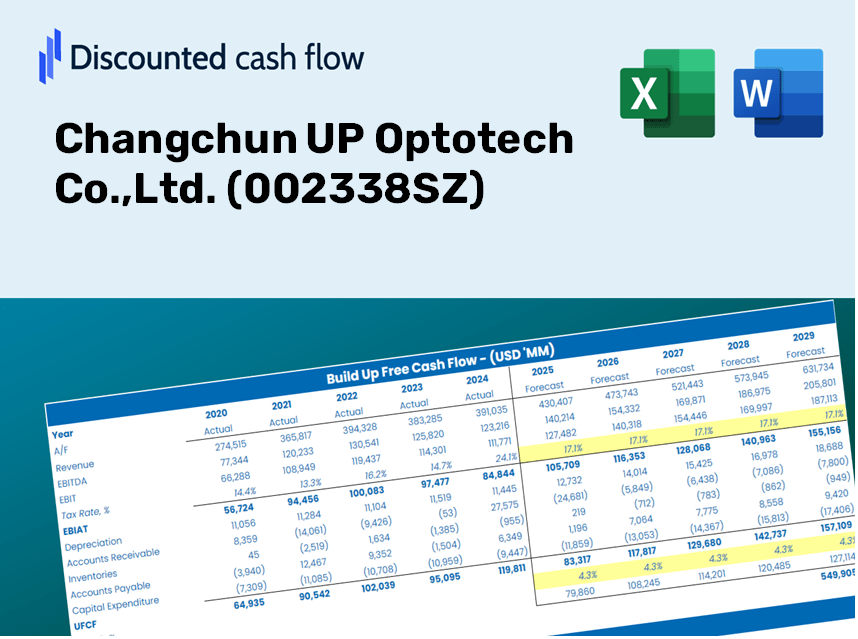
Changchun UP Optotech Co.,Ltd. (002338.SZ) Bundle
¡Agilice su análisis y mejore la precisión con nuestra calculadora DCF (002338SZ)! Utilización de datos reales de Changchun Up Optotech Co., Ltd. y suposiciones personalizables, esta herramienta le permite pronosticar, evaluar y evaluar (002338SZ) como un inversor experimentado.
Discounted Cash Flow (DCF) - (USD MM)
| Year | AY1 2020 |
AY2 2021 |
AY3 2022 |
AY4 2023 |
AY5 2024 |
FY1 2025 |
FY2 2026 |
FY3 2027 |
FY4 2028 |
FY5 2029 |
|---|---|---|---|---|---|---|---|---|---|---|
| Revenue | 440.7 | 546.8 | 627.1 | 773.5 | 745.5 | 854.5 | 979.4 | 1,122.5 | 1,286.6 | 1,474.7 |
| Revenue Growth, % | 0 | 24.07 | 14.67 | 23.34 | -3.62 | 14.62 | 14.62 | 14.62 | 14.62 | 14.62 |
| EBITDA | 45.3 | 63.8 | 70.2 | 133.9 | 97.4 | 108.5 | 124.4 | 142.6 | 163.4 | 187.3 |
| EBITDA, % | 10.28 | 11.66 | 11.19 | 17.31 | 13.07 | 12.7 | 12.7 | 12.7 | 12.7 | 12.7 |
| Depreciation | 25.1 | 25.7 | 31.7 | 44.0 | 45.8 | 46.7 | 53.5 | 61.3 | 70.3 | 80.5 |
| Depreciation, % | 5.71 | 4.71 | 5.06 | 5.69 | 6.14 | 5.46 | 5.46 | 5.46 | 5.46 | 5.46 |
| EBIT | 20.1 | 38.0 | 38.5 | 89.9 | 51.7 | 61.9 | 70.9 | 81.3 | 93.2 | 106.8 |
| EBIT, % | 4.57 | 6.96 | 6.13 | 11.62 | 6.93 | 7.24 | 7.24 | 7.24 | 7.24 | 7.24 |
| Total Cash | 146.8 | 146.4 | 183.2 | 326.1 | 237.4 | 279.1 | 319.8 | 366.6 | 420.2 | 481.6 |
| Total Cash, percent | .0 | .0 | .0 | .0 | .0 | .0 | .0 | .0 | .0 | .0 |
| Account Receivables | 219.4 | 233.0 | 283.0 | 321.9 | 517.3 | 424.7 | 486.8 | 557.9 | 639.5 | 733.0 |
| Account Receivables, % | 49.77 | 42.61 | 45.14 | 41.62 | 69.39 | 49.7 | 49.7 | 49.7 | 49.7 | 49.7 |
| Inventories | 290.8 | 332.7 | 422.2 | 424.0 | 361.5 | 508.3 | 582.6 | 667.8 | 765.4 | 877.3 |
| Inventories, % | 65.97 | 60.84 | 67.33 | 54.82 | 48.49 | 59.49 | 59.49 | 59.49 | 59.49 | 59.49 |
| Accounts Payable | 41.9 | 54.1 | 96.7 | 64.0 | 73.6 | 90.5 | 103.7 | 118.9 | 136.3 | 156.2 |
| Accounts Payable, % | 9.51 | 9.89 | 15.42 | 8.27 | 9.87 | 10.59 | 10.59 | 10.59 | 10.59 | 10.59 |
| Capital Expenditure | -19.3 | -24.6 | -30.8 | -52.1 | -17.4 | -39.1 | -44.8 | -51.4 | -58.9 | -67.5 |
| Capital Expenditure, % | -4.39 | -4.5 | -4.92 | -6.74 | -2.33 | -4.57 | -4.57 | -4.57 | -4.57 | -4.57 |
| Tax Rate, % | 38.57 | 38.57 | 38.57 | 38.57 | 38.57 | 38.57 | 38.57 | 38.57 | 38.57 | 38.57 |
| EBITAT | 18.0 | 33.5 | 31.0 | 61.3 | 31.7 | 48.0 | 55.0 | 63.0 | 72.2 | 82.8 |
| Depreciation | ||||||||||
| Changes in Account Receivables | ||||||||||
| Changes in Inventories | ||||||||||
| Changes in Accounts Payable | ||||||||||
| Capital Expenditure | ||||||||||
| UFCF | -444.4 | -8.8 | -65.1 | -20.1 | -63.1 | 18.2 | -59.5 | -68.2 | -78.2 | -89.6 |
| WACC, % | 7.45 | 7.45 | 7.45 | 7.44 | 7.44 | 7.45 | 7.45 | 7.45 | 7.45 | 7.45 |
| PV UFCF | ||||||||||
| SUM PV UFCF | -210.8 | |||||||||
| Long Term Growth Rate, % | 4.00 | |||||||||
| Free cash flow (T + 1) | -93 | |||||||||
| Terminal Value | -2,704 | |||||||||
| Present Terminal Value | -1,888 | |||||||||
| Enterprise Value | -2,099 | |||||||||
| Net Debt | 16 | |||||||||
| Equity Value | -2,115 | |||||||||
| Diluted Shares Outstanding, MM | 237 | |||||||||
| Equity Value Per Share | -8.92 |
What You Will Receive
- Pre-Loaded Financial Model: Utilizes Changchun UP Optotech Co., Ltd.’s (002338SZ) actual data for accurate DCF valuation.
- Comprehensive Forecast Customization: Modify revenue growth, profit margins, WACC, and other essential factors.
- Real-Time Calculations: Automatic updates provide immediate results as you adjust inputs.
- Professional-Grade Template: An expertly crafted Excel file designed for high-quality valuation.
- Flexible and Reusable: Built for adaptability, enabling repeated application for in-depth forecasts.
Key Features
- Comprehensive Historical Data: Access Changchun UP Optotech’s (002338SZ) financial records and pre-populated forecasts.
- Customizable Inputs: Modify WACC, tax rates, revenue growth, and EBITDA margins as needed.
- Real-Time Calculations: Observe the intrinsic value of Changchun UP Optotech (002338SZ) update instantly.
- Visualized Insights: Interactive dashboard charts present valuation outcomes and essential metrics.
- Designed for Precision: A robust tool tailored for analysts, investors, and financial professionals.
How It Works
- Step 1: Download the Excel template for Changchun UP Optotech Co.,Ltd. (002338SZ).
- Step 2: Examine the pre-filled financial data and forecasts specific to Changchun UP Optotech.
- Step 3: Adjust key inputs such as revenue growth, WACC, and tax rates in the highlighted cells.
- Step 4: Observe the DCF model update in real-time as you modify your assumptions.
- Step 5: Evaluate the results and leverage the findings for informed investment choices.
Why Choose Our Calculator for Changchun UP Optotech Co., Ltd. (002338SZ)?
- Precision: Leveraging accurate financial data from Changchun UP Optotech for reliable results.
- Adaptability: Users can easily test and alter inputs to suit their specific needs.
- Efficiency: Avoid the complexities of constructing a DCF model manually.
- High-Quality: Crafted with the expertise and attention to detail common among top financial professionals.
- User-Friendly Interface: Designed for simplicity, making it accessible for users with varying levels of financial modeling expertise.
Who Can Benefit from Changchun UP Optotech Co., Ltd. (002338SZ)?
- Investors: Leverage a top-tier valuation tool to make informed investment choices.
- Financial Analysts: Streamline your workflow with a customizable DCF model designed for efficiency.
- Consultants: Easily tailor the template for client presentations or analytical reports.
- Finance Enthusiasts: Enhance your knowledge of valuation methods through practical, real-world examples.
- Educators and Students: Utilize it as a valuable resource for finance-related coursework.
Contents of the Template
- Detailed DCF Model: An editable template featuring comprehensive valuation calculations.
- Historical and Projected Data: Preloaded financial data for Changchun UP Optotech Co.,Ltd. (002338SZ) to facilitate analysis.
- Adjustable Assumptions: Modify WACC, growth rates, and tax inputs to evaluate various scenarios.
- Complete Financial Statements: Annual and quarterly financial breakdowns for enhanced insights.
- Essential Ratios: In-depth analysis tools for assessing profitability, efficiency, and leverage.
- Visual Dashboard: Interactive charts and tables that present clear, actionable results.
Disclaimer
All information, articles, and product details provided on this website are for general informational and educational purposes only. We do not claim any ownership over, nor do we intend to infringe upon, any trademarks, copyrights, logos, brand names, or other intellectual property mentioned or depicted on this site. Such intellectual property remains the property of its respective owners, and any references here are made solely for identification or informational purposes, without implying any affiliation, endorsement, or partnership.
We make no representations or warranties, express or implied, regarding the accuracy, completeness, or suitability of any content or products presented. Nothing on this website should be construed as legal, tax, investment, financial, medical, or other professional advice. In addition, no part of this site—including articles or product references—constitutes a solicitation, recommendation, endorsement, advertisement, or offer to buy or sell any securities, franchises, or other financial instruments, particularly in jurisdictions where such activity would be unlawful.
All content is of a general nature and may not address the specific circumstances of any individual or entity. It is not a substitute for professional advice or services. Any actions you take based on the information provided here are strictly at your own risk. You accept full responsibility for any decisions or outcomes arising from your use of this website and agree to release us from any liability in connection with your use of, or reliance upon, the content or products found herein.