
|
Haining China Leather Market Co., Ltd (002344.sz) Valoración de DCF |
Completamente Editable: Adáptelo A Sus Necesidades En Excel O Sheets
Diseño Profesional: Plantillas Confiables Y Estándares De La Industria
Predeterminadas Para Un Uso Rápido Y Eficiente
Compatible con MAC / PC, completamente desbloqueado
No Se Necesita Experiencia; Fáciles De Seguir
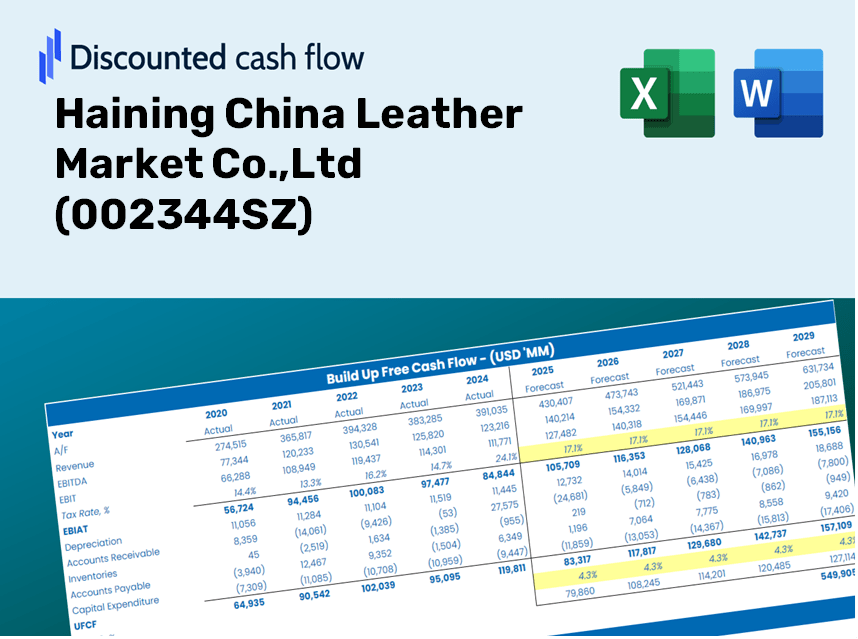
Haining China Leather Market Co.,Ltd (002344.SZ) Bundle
¡Evalúe la perspectiva financiera de Haining China Leather Market Co., Ltd como un experto! Esta calculadora DCF (002344SZ) le proporciona datos financieros precipidos y la flexibilidad para modificar el crecimiento de los ingresos, WACC, los márgenes y otros supuestos cruciales para alinearse con sus proyecciones.
Discounted Cash Flow (DCF) - (USD MM)
| Year | AY1 2020 |
AY2 2021 |
AY3 2022 |
AY4 2023 |
AY5 2024 |
FY1 2025 |
FY2 2026 |
FY3 2027 |
FY4 2028 |
FY5 2029 |
|---|---|---|---|---|---|---|---|---|---|---|
| Revenue | 1,432.8 | 1,455.6 | 1,392.6 | 1,291.1 | 1,096.3 | 1,027.5 | 963.0 | 902.5 | 845.9 | 792.8 |
| Revenue Growth, % | 0 | 1.59 | -4.33 | -7.29 | -15.09 | -6.28 | -6.28 | -6.28 | -6.28 | -6.28 |
| EBITDA | 668.7 | 830.8 | 817.2 | 683.0 | 455.9 | 527.9 | 494.8 | 463.7 | 434.6 | 407.3 |
| EBITDA, % | 46.67 | 57.07 | 58.68 | 52.9 | 41.58 | 51.38 | 51.38 | 51.38 | 51.38 | 51.38 |
| Depreciation | 1,128.4 | 1,070.8 | 1,017.1 | 347.5 | 344.6 | 583.0 | 546.4 | 512.1 | 480.0 | 449.8 |
| Depreciation, % | 78.75 | 73.56 | 73.04 | 26.91 | 31.43 | 56.74 | 56.74 | 56.74 | 56.74 | 56.74 |
| EBIT | -459.7 | -240.0 | -199.9 | 335.5 | 111.3 | -55.1 | -51.6 | -48.4 | -45.3 | -42.5 |
| EBIT, % | -32.09 | -16.49 | -14.36 | 25.99 | 10.15 | -5.36 | -5.36 | -5.36 | -5.36 | -5.36 |
| Total Cash | 1,178.3 | 1,844.1 | 2,436.7 | 1,250.4 | 1,233.5 | 984.5 | 922.7 | 864.8 | 810.5 | 759.6 |
| Total Cash, percent | .0 | .0 | .0 | .0 | .0 | .0 | .0 | .0 | .0 | .0 |
| Account Receivables | 3.2 | 121.1 | 30.7 | 83.3 | 127.7 | 59.3 | 55.6 | 52.1 | 48.8 | 45.7 |
| Account Receivables, % | 0.22192 | 8.32 | 2.21 | 6.45 | 11.65 | 5.77 | 5.77 | 5.77 | 5.77 | 5.77 |
| Inventories | 756.9 | 699.8 | 957.4 | 878.2 | 1,029.1 | 681.3 | 638.5 | 598.4 | 560.9 | 525.7 |
| Inventories, % | 52.83 | 48.07 | 68.75 | 68.02 | 93.87 | 66.31 | 66.31 | 66.31 | 66.31 | 66.31 |
| Accounts Payable | 308.5 | 289.8 | 849.4 | 490.7 | 524.0 | 386.8 | 362.5 | 339.8 | 318.5 | 298.5 |
| Accounts Payable, % | 21.53 | 19.91 | 61 | 38 | 47.8 | 37.65 | 37.65 | 37.65 | 37.65 | 37.65 |
| Capital Expenditure | -294.1 | -321.6 | -214.4 | -116.0 | -128.8 | -161.8 | -151.7 | -142.1 | -133.2 | -124.9 |
| Capital Expenditure, % | -20.52 | -22.1 | -15.4 | -8.99 | -11.75 | -15.75 | -15.75 | -15.75 | -15.75 | -15.75 |
| Tax Rate, % | 51.86 | 51.86 | 51.86 | 51.86 | 51.86 | 51.86 | 51.86 | 51.86 | 51.86 | 51.86 |
| EBITAT | -318.1 | -173.3 | -131.6 | 214.5 | 53.6 | -35.2 | -32.9 | -30.9 | -28.9 | -27.1 |
| Depreciation | ||||||||||
| Changes in Account Receivables | ||||||||||
| Changes in Inventories | ||||||||||
| Changes in Accounts Payable | ||||||||||
| Capital Expenditure | ||||||||||
| UFCF | 64.6 | 496.5 | 1,063.5 | 113.9 | 107.4 | 665.0 | 384.0 | 359.9 | 337.3 | 316.1 |
| WACC, % | 5.59 | 5.61 | 5.56 | 5.55 | 5.44 | 5.55 | 5.55 | 5.55 | 5.55 | 5.55 |
| PV UFCF | ||||||||||
| SUM PV UFCF | 1,793.9 | |||||||||
| Long Term Growth Rate, % | 2.00 | |||||||||
| Free cash flow (T + 1) | 322 | |||||||||
| Terminal Value | 9,084 | |||||||||
| Present Terminal Value | 6,934 | |||||||||
| Enterprise Value | 8,728 | |||||||||
| Net Debt | -126 | |||||||||
| Equity Value | 8,853 | |||||||||
| Diluted Shares Outstanding, MM | 1,283 | |||||||||
| Equity Value Per Share | 6.90 |
Benefits of Choosing Haining China Leather Market Co., Ltd (002344SZ)
- Comprehensive Financial Model: Utilize Haining’s real data for accurate DCF valuation.
- Complete Forecast Flexibility: Modify revenue growth, profit margins, WACC, and other essential metrics.
- Real-Time Calculations: Automatic updates provide immediate feedback as you adjust inputs.
- Professionally Designed Template: A polished Excel file tailored for high-quality valuation presentations.
- Flexible and Reusable: Customizable for repeated use, ideal for in-depth forecasting.
Key Features
- Real-Life Haining Data: Pre-filled with Haining China Leather Market Co., Ltd's historical financials and forward-looking projections.
- Fully Customizable Inputs: Modify revenue growth, profit margins, WACC, tax rates, and capital expenditures as needed.
- Dynamic Valuation Model: Automatic updates to Net Present Value (NPV) and intrinsic value based on your specified inputs.
- Scenario Testing: Generate multiple forecast scenarios to evaluate various valuation outcomes.
- User-Friendly Design: Intuitive layout, structured for both professionals and novices.
How It Works
- Step 1: Download the prebuilt Excel template containing Haining China Leather Market Co., Ltd's (002344SZ) data.
- Step 2: Navigate through the pre-filled sheets to familiarize yourself with the key metrics.
- Step 3: Modify the forecasts and assumptions in the editable yellow cells (WACC, growth, margins).
- Step 4: Instantly view the recalculated results, including Haining China Leather Market Co., Ltd's (002344SZ) intrinsic value.
- Step 5: Make informed investment decisions or create reports based on the generated outputs.
Why Choose This Calculator for Haining China Leather Market Co., Ltd (002344SZ)?
- User-Friendly Interface: Tailored for both novices and seasoned professionals.
- Customizable Inputs: Easily adjust parameters to suit your financial analysis.
- Real-Time Updates: Instantly observe changes in Haining's valuation as you modify inputs.
- Pre-Configured Data: Comes with Haining's actual financial metrics for swift evaluations.
- Relied Upon by Experts: A favorite among investors and analysts for making well-informed choices.
Who Can Benefit from Our Product?
- Finance Students: Master valuation methods and apply them using authentic market data.
- Academics: Integrate industry-standard models into your teaching or research initiatives.
- Investors: Validate your own hypotheses and analyze valuation results for Haining China Leather Market Co.,Ltd (002344SZ).
- Analysts: Enhance your efficiency with our ready-to-use, customizable DCF model.
- Small Business Owners: Understand the analytical methods used for large public companies like Haining China Leather Market Co.,Ltd (002344SZ).
Contents of the Template
- Pre-Filled DCF Model: Haining China Leather Market Co., Ltd’s financial data preloaded for quick utilization.
- WACC Calculator: Comprehensive calculations for the Weighted Average Cost of Capital.
- Financial Ratios: Assess Haining China Leather Market Co., Ltd’s profitability, leverage, and operational efficiency.
- Editable Inputs: Modify assumptions like growth rates, profit margins, and capital expenditures to suit your analyses.
- Financial Statements: Access annual and quarterly reports for thorough evaluation.
- Interactive Dashboard: Effortlessly visualize essential valuation metrics and outcomes.
Disclaimer
All information, articles, and product details provided on this website are for general informational and educational purposes only. We do not claim any ownership over, nor do we intend to infringe upon, any trademarks, copyrights, logos, brand names, or other intellectual property mentioned or depicted on this site. Such intellectual property remains the property of its respective owners, and any references here are made solely for identification or informational purposes, without implying any affiliation, endorsement, or partnership.
We make no representations or warranties, express or implied, regarding the accuracy, completeness, or suitability of any content or products presented. Nothing on this website should be construed as legal, tax, investment, financial, medical, or other professional advice. In addition, no part of this site—including articles or product references—constitutes a solicitation, recommendation, endorsement, advertisement, or offer to buy or sell any securities, franchises, or other financial instruments, particularly in jurisdictions where such activity would be unlawful.
All content is of a general nature and may not address the specific circumstances of any individual or entity. It is not a substitute for professional advice or services. Any actions you take based on the information provided here are strictly at your own risk. You accept full responsibility for any decisions or outcomes arising from your use of this website and agree to release us from any liability in connection with your use of, or reliance upon, the content or products found herein.