
|
Jinghua Pharmaceutical Group Co., Ltd. (002349.sz) Valoración de DCF |
Completamente Editable: Adáptelo A Sus Necesidades En Excel O Sheets
Diseño Profesional: Plantillas Confiables Y Estándares De La Industria
Predeterminadas Para Un Uso Rápido Y Eficiente
Compatible con MAC / PC, completamente desbloqueado
No Se Necesita Experiencia; Fáciles De Seguir
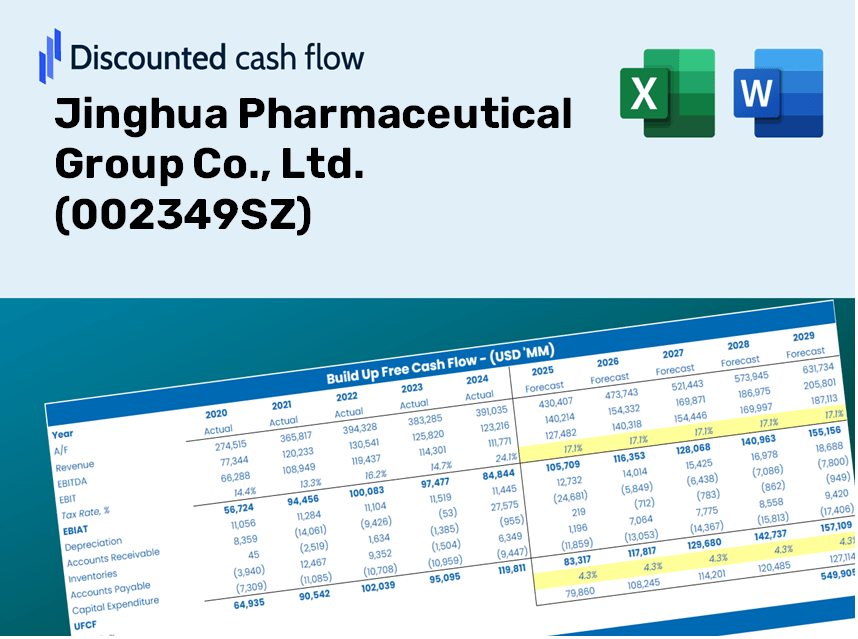
Jinghua Pharmaceutical Group Co., Ltd. (002349.SZ) Bundle
¡Mejore sus opciones de inversión con la calculadora DCF Jinghua Pharmaceutical Group Co., Ltd. (002349SZ)! Utilice datos financieros precisos, ajuste las proyecciones y gastos de crecimiento, y observe instantáneamente cómo estas modificaciones afectan el valor intrínseco del grupo farmacéutico Jinghua.
Discounted Cash Flow (DCF) - (USD MM)
| Year | AY1 2020 |
AY2 2021 |
AY3 2022 |
AY4 2023 |
AY5 2024 |
FY1 2025 |
FY2 2026 |
FY3 2027 |
FY4 2028 |
FY5 2029 |
|---|---|---|---|---|---|---|---|---|---|---|
| Revenue | 1,281.4 | 1,357.9 | 1,573.1 | 1,511.8 | 1,402.1 | 1,439.5 | 1,477.9 | 1,517.3 | 1,557.7 | 1,599.3 |
| Revenue Growth, % | 0 | 5.97 | 15.85 | -3.9 | -7.25 | 2.67 | 2.67 | 2.67 | 2.67 | 2.67 |
| EBITDA | 167.4 | 294.9 | 370.0 | 417.6 | 371.2 | 323.6 | 332.2 | 341.1 | 350.2 | 359.5 |
| EBITDA, % | 13.06 | 21.72 | 23.52 | 27.62 | 26.47 | 22.48 | 22.48 | 22.48 | 22.48 | 22.48 |
| Depreciation | 84.0 | 105.2 | 112.8 | 85.3 | 76.5 | 93.8 | 96.3 | 98.8 | 101.5 | 104.2 |
| Depreciation, % | 6.56 | 7.75 | 7.17 | 5.65 | 5.46 | 6.51 | 6.51 | 6.51 | 6.51 | 6.51 |
| EBIT | 83.4 | 189.7 | 257.3 | 332.3 | 294.7 | 229.8 | 236.0 | 242.3 | 248.7 | 255.3 |
| EBIT, % | 6.51 | 13.97 | 16.35 | 21.98 | 21.02 | 15.97 | 15.97 | 15.97 | 15.97 | 15.97 |
| Total Cash | 696.1 | 865.0 | 1,058.2 | 1,239.5 | 1,118.8 | 999.2 | 1,025.9 | 1,053.2 | 1,081.3 | 1,110.1 |
| Total Cash, percent | .0 | .0 | .0 | .0 | .0 | .0 | .0 | .0 | .0 | .0 |
| Account Receivables | 367.2 | 372.9 | 339.2 | 387.7 | 417.3 | 383.2 | 393.4 | 403.9 | 414.6 | 425.7 |
| Account Receivables, % | 28.66 | 27.47 | 21.56 | 25.64 | 29.76 | 26.62 | 26.62 | 26.62 | 26.62 | 26.62 |
| Inventories | 307.8 | 323.1 | 307.7 | 290.9 | 270.3 | 304.9 | 313.0 | 321.4 | 329.9 | 338.7 |
| Inventories, % | 24.02 | 23.8 | 19.56 | 19.25 | 19.28 | 21.18 | 21.18 | 21.18 | 21.18 | 21.18 |
| Accounts Payable | 180.6 | 213.1 | 139.6 | 141.9 | 148.4 | 168.8 | 173.3 | 177.9 | 182.7 | 187.6 |
| Accounts Payable, % | 14.1 | 15.69 | 8.87 | 9.39 | 10.59 | 11.73 | 11.73 | 11.73 | 11.73 | 11.73 |
| Capital Expenditure | -118.5 | -80.5 | -61.6 | -28.4 | -30.9 | -66.7 | -68.5 | -70.3 | -72.2 | -74.1 |
| Capital Expenditure, % | -9.25 | -5.93 | -3.92 | -1.88 | -2.21 | -4.63 | -4.63 | -4.63 | -4.63 | -4.63 |
| Tax Rate, % | 27.5 | 27.5 | 27.5 | 27.5 | 27.5 | 27.5 | 27.5 | 27.5 | 27.5 | 27.5 |
| EBITAT | 145.2 | 170.5 | 218.2 | 249.6 | 213.6 | 194.1 | 199.3 | 204.6 | 210.1 | 215.7 |
| Depreciation | ||||||||||
| Changes in Account Receivables | ||||||||||
| Changes in Inventories | ||||||||||
| Changes in Accounts Payable | ||||||||||
| Capital Expenditure | ||||||||||
| UFCF | -383.7 | 206.5 | 245.2 | 277.1 | 256.7 | 241.1 | 213.2 | 218.9 | 224.7 | 230.7 |
| WACC, % | 4.55 | 4.55 | 4.55 | 4.55 | 4.55 | 4.55 | 4.55 | 4.55 | 4.55 | 4.55 |
| PV UFCF | ||||||||||
| SUM PV UFCF | 990.1 | |||||||||
| Long Term Growth Rate, % | 3.50 | |||||||||
| Free cash flow (T + 1) | 239 | |||||||||
| Terminal Value | 22,772 | |||||||||
| Present Terminal Value | 18,231 | |||||||||
| Enterprise Value | 19,221 | |||||||||
| Net Debt | -1,003 | |||||||||
| Equity Value | 20,224 | |||||||||
| Diluted Shares Outstanding, MM | 814 | |||||||||
| Equity Value Per Share | 24.84 |
Your Benefits
- Adjustable Forecast Parameters: Modify key assumptions (growth %, margins, WACC) effortlessly to explore various scenarios.
- Comprehensive Industry Data: Pre-filled financial information for Jinghua Pharmaceutical Group Co., Ltd. (002349SZ) to kickstart your analysis.
- Automated DCF Results: The model computes Net Present Value (NPV) and intrinsic value automatically for your convenience.
- Sleek and Adaptable Design: A professional-grade Excel model tailored to meet your valuation requirements.
- Designed for Analysts and Investors: Perfect for evaluating forecasts, confirming strategies, and enhancing efficiency.
Core Features
- Customizable Forecast Inputs: Adjust essential metrics such as sales growth, net profit margin, and R&D spending.
- Instant DCF Valuation: Quickly computes intrinsic value, net present value (NPV), and other financial outputs.
- High-Precision Accuracy: Incorporates Jinghua Pharmaceutical's actual financial data for realistic valuation assessments.
- Effortless Scenario Analysis: Easily explore various assumptions and evaluate their impact on outcomes.
- Efficiency Booster: Avoid the hassle of constructing complicated valuation models from the ground up.
How It Works
- Download the Template: Gain immediate access to the Excel-based Jinghua Pharmaceutical DCF Calculator.
- Input Your Assumptions: Modify the yellow-highlighted cells for growth rates, WACC, margins, and additional parameters.
- Instant Calculations: The model will automatically refresh Jinghua Pharmaceutical’s intrinsic value.
- Test Scenarios: Experiment with various assumptions to assess potential changes in valuation.
- Analyze and Decide: Leverage the findings to inform your investment or financial analysis.
Why Opt for This Calculator?
- Designed for Experts: A sophisticated tool utilized by analysts, CFOs, and consultants in the pharmaceutical sector.
- Accurate Data: Jinghua Pharmaceutical Group's historical and projected financials are preloaded for precision.
- Versatile Scenario Testing: Effortlessly simulate various forecasts and assumptions.
- Comprehensive Outputs: Instantly calculates intrinsic value, NPV, and essential metrics.
- User-Friendly: Detailed step-by-step instructions make the process straightforward.
Who Can Benefit from This Product?
- Investors: Assess Jinghua Pharmaceutical's valuation before making stock trades.
- CFOs and Financial Analysts: Enhance valuation methodologies and evaluate financial forecasts.
- Startup Founders: Understand the valuation approaches of established pharmaceutical companies like Jinghua Pharmaceutical.
- Consultants: Create comprehensive valuation reports for your clients.
- Students and Educators: Utilize real-time data to learn and teach valuation strategies.
Contents of the Template
- Preloaded JHG Data: Historical and projected financial metrics, including revenue, EBIT, and capital expenditures.
- DCF and WACC Models: Advanced spreadsheets designed for calculating intrinsic value and Weighted Average Cost of Capital.
- Editable Inputs: Yellow-highlighted fields for modifying revenue growth, tax rates, and discount rates.
- Financial Statements: Detailed annual and quarterly financial reports for in-depth analysis.
- Key Ratios: Profitability, leverage, and efficiency metrics to assess performance.
- Dashboard and Charts: Visual representations of valuation results and underlying assumptions.
Disclaimer
All information, articles, and product details provided on this website are for general informational and educational purposes only. We do not claim any ownership over, nor do we intend to infringe upon, any trademarks, copyrights, logos, brand names, or other intellectual property mentioned or depicted on this site. Such intellectual property remains the property of its respective owners, and any references here are made solely for identification or informational purposes, without implying any affiliation, endorsement, or partnership.
We make no representations or warranties, express or implied, regarding the accuracy, completeness, or suitability of any content or products presented. Nothing on this website should be construed as legal, tax, investment, financial, medical, or other professional advice. In addition, no part of this site—including articles or product references—constitutes a solicitation, recommendation, endorsement, advertisement, or offer to buy or sell any securities, franchises, or other financial instruments, particularly in jurisdictions where such activity would be unlawful.
All content is of a general nature and may not address the specific circumstances of any individual or entity. It is not a substitute for professional advice or services. Any actions you take based on the information provided here are strictly at your own risk. You accept full responsibility for any decisions or outcomes arising from your use of this website and agree to release us from any liability in connection with your use of, or reliance upon, the content or products found herein.