
|
Yibin Tianyuan Group Co., Ltd. (002386.sz) DCF Valoración |
Completamente Editable: Adáptelo A Sus Necesidades En Excel O Sheets
Diseño Profesional: Plantillas Confiables Y Estándares De La Industria
Predeterminadas Para Un Uso Rápido Y Eficiente
Compatible con MAC / PC, completamente desbloqueado
No Se Necesita Experiencia; Fáciles De Seguir
Yibin Tianyuan Group Co., Ltd. (002386.SZ) Bundle
¡Agilice su análisis y mejore la precisión con nuestra calculadora DCF (002386SZ)! Utilizando datos reales de Yibin Tianyuan Group Co., Ltd. y suposiciones personalizables, esta herramienta le permite pronosticar, evaluar y valorar Yibin Tianyuan como un inversor experimentado.
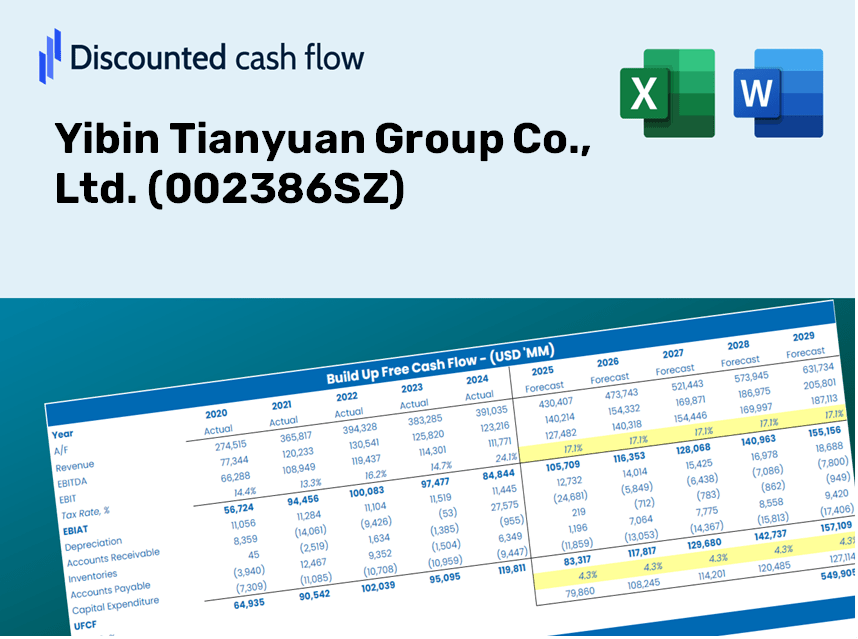
Discounted Cash Flow (DCF) - (USD MM)
| Year | AY1 2020 |
AY2 2021 |
AY3 2022 |
AY4 2023 |
AY5 2024 |
FY1 2025 |
FY2 2026 |
FY3 2027 |
FY4 2028 |
FY5 2029 |
|---|---|---|---|---|---|---|---|---|---|---|
| Revenue | 21,646.1 | 18,824.9 | 20,339.4 | 18,366.7 | 13,367.1 | 11,966.6 | 10,712.9 | 9,590.5 | 8,585.7 | 7,686.2 |
| Revenue Growth, % | 0 | -13.03 | 8.05 | -9.7 | -27.22 | -10.48 | -10.48 | -10.48 | -10.48 | -10.48 |
| EBITDA | 788.0 | 1,488.1 | 1,177.3 | 577.3 | 44.0 | 498.0 | 445.8 | 399.1 | 357.3 | 319.8 |
| EBITDA, % | 3.64 | 7.9 | 5.79 | 3.14 | 0.32907 | 4.16 | 4.16 | 4.16 | 4.16 | 4.16 |
| Depreciation | 507.4 | 441.6 | 494.6 | 486.9 | 510.5 | 325.3 | 291.2 | 260.7 | 233.4 | 208.9 |
| Depreciation, % | 2.34 | 2.35 | 2.43 | 2.65 | 3.82 | 2.72 | 2.72 | 2.72 | 2.72 | 2.72 |
| EBIT | 280.6 | 1,046.5 | 682.8 | 90.4 | -466.5 | 172.7 | 154.6 | 138.4 | 123.9 | 110.9 |
| EBIT, % | 1.3 | 5.56 | 3.36 | 0.49241 | -3.49 | 1.44 | 1.44 | 1.44 | 1.44 | 1.44 |
| Total Cash | 3,273.7 | 3,233.8 | 2,651.7 | 3,449.7 | 3,184.2 | 2,104.8 | 1,884.3 | 1,686.8 | 1,510.1 | 1,351.9 |
| Total Cash, percent | .0 | .0 | .0 | .0 | .0 | .0 | .0 | .0 | .0 | .0 |
| Account Receivables | 1,182.0 | 1,806.3 | 1,104.2 | 1,175.9 | 1,449.5 | 903.0 | 808.4 | 723.7 | 647.9 | 580.0 |
| Account Receivables, % | 5.46 | 9.6 | 5.43 | 6.4 | 10.84 | 7.55 | 7.55 | 7.55 | 7.55 | 7.55 |
| Inventories | 628.4 | 796.9 | 847.7 | 1,056.2 | 1,248.3 | 631.7 | 565.5 | 506.2 | 453.2 | 405.7 |
| Inventories, % | 2.9 | 4.23 | 4.17 | 5.75 | 9.34 | 5.28 | 5.28 | 5.28 | 5.28 | 5.28 |
| Accounts Payable | 1,232.6 | 2,718.0 | 1,986.0 | 2,975.2 | 3,829.8 | 1,789.0 | 1,601.5 | 1,433.7 | 1,283.5 | 1,149.0 |
| Accounts Payable, % | 5.69 | 14.44 | 9.76 | 16.2 | 28.65 | 14.95 | 14.95 | 14.95 | 14.95 | 14.95 |
| Capital Expenditure | -301.1 | -279.4 | -289.9 | -1,767.6 | -1,263.3 | -559.4 | -500.8 | -448.4 | -401.4 | -359.3 |
| Capital Expenditure, % | -1.39 | -1.48 | -1.43 | -9.62 | -9.45 | -4.68 | -4.68 | -4.68 | -4.68 | -4.68 |
| Tax Rate, % | 8.05 | 8.05 | 8.05 | 8.05 | 8.05 | 8.05 | 8.05 | 8.05 | 8.05 | 8.05 |
| EBITAT | 164.4 | 884.5 | 577.6 | 192.1 | -429.0 | 144.9 | 129.7 | 116.1 | 104.0 | 93.1 |
| Depreciation | ||||||||||
| Changes in Account Receivables | ||||||||||
| Changes in Inventories | ||||||||||
| Changes in Accounts Payable | ||||||||||
| Capital Expenditure | ||||||||||
| UFCF | -206.9 | 1,739.3 | 701.4 | -379.4 | -792.9 | -967.0 | -106.5 | -95.4 | -85.4 | -76.4 |
| WACC, % | 5.76 | 6.19 | 6.2 | 6.45 | 6.32 | 6.18 | 6.18 | 6.18 | 6.18 | 6.18 |
| PV UFCF | ||||||||||
| SUM PV UFCF | -1,208.6 | |||||||||
| Long Term Growth Rate, % | 2.00 | |||||||||
| Free cash flow (T + 1) | -78 | |||||||||
| Terminal Value | -1,863 | |||||||||
| Present Terminal Value | -1,380 | |||||||||
| Enterprise Value | -2,589 | |||||||||
| Net Debt | 2,183 | |||||||||
| Equity Value | -4,772 | |||||||||
| Diluted Shares Outstanding, MM | 1,302 | |||||||||
| Equity Value Per Share | -3.67 |
What You Will Receive
- Authentic Yibin Tianyuan Financial Data: Pre-loaded with Yibin Tianyuan's historical and forecasted data for accurate analysis.
- Completely Customizable Template: Easily adjust key inputs such as revenue growth, WACC, and EBITDA percentage.
- Instant Calculations: Watch Yibin Tianyuan's intrinsic value update immediately based on your modifications.
- Expert Valuation Tool: Tailored for investors, analysts, and consultants focused on precise DCF outcomes.
- Intuitive Design: Clear layout and straightforward instructions suitable for all levels of expertise.
Key Features
- Authentic Financial Data: Gain access to reliable pre-loaded historical figures and future forecasts for Yibin Tianyuan Group Co., Ltd. (002386SZ).
- Adjustable Forecast Parameters: Modify the highlighted cells, including WACC, growth rates, and profit margins.
- Real-Time Calculations: Enjoy automatic updates for DCF, Net Present Value (NPV), and cash flow assessments.
- User-Friendly Dashboard: Utilize clear charts and summaries to easily interpret your valuation outcomes.
- Suitable for All Skill Levels: Designed with a straightforward layout for investors, CFOs, and consultants alike.
How It Works
- Step 1: Download the prebuilt Excel template featuring Yibin Tianyuan Group Co., Ltd.'s data.
- Step 2: Review the pre-filled sheets to familiarize yourself with the key metrics.
- Step 3: Modify forecasts and assumptions in the editable yellow cells (WACC, growth, margins).
- Step 4: Instantly see recalculated results, including Yibin Tianyuan Group Co., Ltd.'s intrinsic value.
- Step 5: Use the outputs to make informed investment decisions or generate comprehensive reports.
Why Choose Yibin Tianyuan Group's Calculator?
- Precision: Leveraging authentic Yibin Tianyuan financial data for reliable outcomes.
- Versatility: Tailored for users to easily adjust and experiment with various inputs.
- Efficiency: Eliminate the complexities of creating a DCF model from the ground up.
- Expert-Level: Crafted with the accuracy and functionality that CFOs demand.
- Intuitive: Simple to navigate, making it accessible for those new to financial modeling.
Who Should Utilize This Product?
- Institutional Investors: Develop comprehensive and trustworthy valuation models for portfolio assessment related to Yibin Tianyuan Group Co., Ltd. (002386SZ).
- Corporate Finance Departments: Evaluate valuation scenarios to influence internal business strategies.
- Consultants and Financial Advisors: Deliver precise valuation insights for clients interested in Yibin Tianyuan Group Co., Ltd. (002386SZ).
- Students and Academic Professionals: Apply real-world data for hands-on practice in financial modeling and analysis.
- Industry Analysts: Gain insights into the valuation of companies like Yibin Tianyuan Group Co., Ltd. (002386SZ) in the market landscape.
Contents of the Template
- Pre-Filled Data: Contains Yibin Tianyuan Group Co., Ltd.'s historical financials and projections.
- Discounted Cash Flow Model: An editable DCF valuation model with automatic calculations included.
- Weighted Average Cost of Capital (WACC): A specific sheet for calculating WACC with customizable inputs.
- Key Financial Ratios: Evaluate Yibin Tianyuan's profitability, efficiency, and financial leverage.
- Customizable Inputs: Easily adjust revenue growth, margins, and tax rates.
- Clear Dashboard: Visual charts and tables summarizing important valuation outcomes.
Disclaimer
All information, articles, and product details provided on this website are for general informational and educational purposes only. We do not claim any ownership over, nor do we intend to infringe upon, any trademarks, copyrights, logos, brand names, or other intellectual property mentioned or depicted on this site. Such intellectual property remains the property of its respective owners, and any references here are made solely for identification or informational purposes, without implying any affiliation, endorsement, or partnership.
We make no representations or warranties, express or implied, regarding the accuracy, completeness, or suitability of any content or products presented. Nothing on this website should be construed as legal, tax, investment, financial, medical, or other professional advice. In addition, no part of this site—including articles or product references—constitutes a solicitation, recommendation, endorsement, advertisement, or offer to buy or sell any securities, franchises, or other financial instruments, particularly in jurisdictions where such activity would be unlawful.
All content is of a general nature and may not address the specific circumstances of any individual or entity. It is not a substitute for professional advice or services. Any actions you take based on the information provided here are strictly at your own risk. You accept full responsibility for any decisions or outcomes arising from your use of this website and agree to release us from any liability in connection with your use of, or reliance upon, the content or products found herein.