
|
Harbin Gloria Pharmaceuticals Co., Ltd (002437.sz) Valoración de DCF |
Completamente Editable: Adáptelo A Sus Necesidades En Excel O Sheets
Diseño Profesional: Plantillas Confiables Y Estándares De La Industria
Predeterminadas Para Un Uso Rápido Y Eficiente
Compatible con MAC / PC, completamente desbloqueado
No Se Necesita Experiencia; Fáciles De Seguir
Harbin Gloria Pharmaceuticals Co., Ltd (002437.SZ) Bundle
¡Explore el potencial financiero de Harbin Gloria Pharmaceuticals Co., Ltd (002437SZ) con nuestra calculadora DCF fácil de usar! Ingrese sus suposiciones con respecto al crecimiento, los márgenes y los gastos para calcular el valor intrínseco de Harbin Gloria Pharmaceuticals Co., LTD (002437SZ) y refinar su enfoque de inversión.
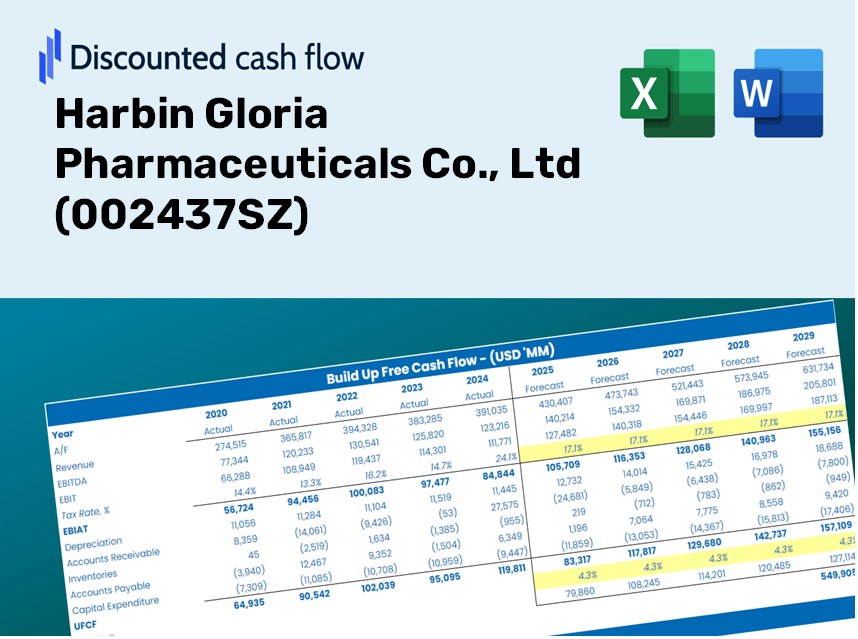
Discounted Cash Flow (DCF) - (USD MM)
| Year | AY1 2020 |
AY2 2021 |
AY3 2022 |
AY4 2023 |
AY5 2024 |
FY1 2025 |
FY2 2026 |
FY3 2027 |
FY4 2028 |
FY5 2029 |
|---|---|---|---|---|---|---|---|---|---|---|
| Revenue | 3,054.9 | 3,145.3 | 3,107.9 | 2,626.0 | 2,440.7 | 2,313.9 | 2,193.6 | 2,079.6 | 1,971.5 | 1,869.0 |
| Revenue Growth, % | 0 | 2.96 | -1.19 | -15.51 | -7.06 | -5.2 | -5.2 | -5.2 | -5.2 | -5.2 |
| EBITDA | 818.9 | 302.0 | 18.5 | 323.8 | 385.5 | 301.4 | 285.7 | 270.9 | 256.8 | 243.4 |
| EBITDA, % | 26.8 | 9.6 | 0.59537 | 12.33 | 15.79 | 13.02 | 13.02 | 13.02 | 13.02 | 13.02 |
| Depreciation | 161.2 | 150.2 | 135.7 | 104.4 | 92.0 | 102.5 | 97.2 | 92.2 | 87.4 | 82.8 |
| Depreciation, % | 5.28 | 4.77 | 4.37 | 3.97 | 3.77 | 4.43 | 4.43 | 4.43 | 4.43 | 4.43 |
| EBIT | 657.7 | 151.8 | -117.2 | 219.4 | 293.5 | 198.8 | 188.5 | 178.7 | 169.4 | 160.6 |
| EBIT, % | 21.53 | 4.83 | -3.77 | 8.36 | 12.03 | 8.59 | 8.59 | 8.59 | 8.59 | 8.59 |
| Total Cash | 895.4 | 1,495.7 | 1,288.3 | 711.3 | 512.0 | 770.0 | 729.9 | 692.0 | 656.0 | 621.9 |
| Total Cash, percent | .0 | .0 | .0 | .0 | .0 | .0 | .0 | .0 | .0 | .0 |
| Account Receivables | 339.6 | 318.4 | 236.8 | 241.1 | 147.5 | 204.0 | 193.4 | 183.4 | 173.8 | 164.8 |
| Account Receivables, % | 11.11 | 10.12 | 7.62 | 9.18 | 6.04 | 8.82 | 8.82 | 8.82 | 8.82 | 8.82 |
| Inventories | 371.0 | 352.1 | 214.1 | 190.7 | 188.7 | 209.3 | 198.4 | 188.1 | 178.3 | 169.0 |
| Inventories, % | 12.14 | 11.19 | 6.89 | 7.26 | 7.73 | 9.04 | 9.04 | 9.04 | 9.04 | 9.04 |
| Accounts Payable | 284.4 | 270.5 | 75.5 | 69.9 | 60.4 | 117.9 | 111.8 | 105.9 | 100.4 | 95.2 |
| Accounts Payable, % | 9.31 | 8.6 | 2.43 | 2.66 | 2.48 | 5.09 | 5.09 | 5.09 | 5.09 | 5.09 |
| Capital Expenditure | -43.7 | -34.5 | -33.0 | -29.6 | -62.9 | -33.8 | -32.0 | -30.3 | -28.8 | -27.3 |
| Capital Expenditure, % | -1.43 | -1.1 | -1.06 | -1.13 | -2.58 | -1.46 | -1.46 | -1.46 | -1.46 | -1.46 |
| Tax Rate, % | 17.95 | 17.95 | 17.95 | 17.95 | 17.95 | 17.95 | 17.95 | 17.95 | 17.95 | 17.95 |
| EBITAT | 465.6 | 79.5 | -125.8 | 149.4 | 240.8 | 148.4 | 140.7 | 133.4 | 126.5 | 119.9 |
| Depreciation | ||||||||||
| Changes in Account Receivables | ||||||||||
| Changes in Inventories | ||||||||||
| Changes in Accounts Payable | ||||||||||
| Capital Expenditure | ||||||||||
| UFCF | 156.9 | 221.3 | 1.4 | 237.7 | 356.1 | 197.6 | 221.3 | 209.8 | 198.9 | 188.6 |
| WACC, % | 4.63 | 4.6 | 4.67 | 4.63 | 4.64 | 4.63 | 4.63 | 4.63 | 4.63 | 4.63 |
| PV UFCF | ||||||||||
| SUM PV UFCF | 890.3 | |||||||||
| Long Term Growth Rate, % | 4.00 | |||||||||
| Free cash flow (T + 1) | 196 | |||||||||
| Terminal Value | 30,902 | |||||||||
| Present Terminal Value | 24,638 | |||||||||
| Enterprise Value | 25,529 | |||||||||
| Net Debt | -480 | |||||||||
| Equity Value | 26,009 | |||||||||
| Diluted Shares Outstanding, MM | 2,262 | |||||||||
| Equity Value Per Share | 11.50 |
What You Will Receive
- Pre-Filled Financial Model: Utilize Harbin Gloria Pharmaceuticals' actual data for accurate DCF valuation.
- Comprehensive Forecast Control: Easily adjust revenue growth, profit margins, WACC, and other essential parameters.
- Instantaneous Calculations: Real-time updates provide immediate insights as you modify inputs.
- Professional-Grade Template: A polished Excel file created for sophisticated valuation purposes.
- Customizable and Reusable: Designed for adaptability, allowing repeated applications for thorough forecasting.
Key Features
- Comprehensive DCF Calculator: Features detailed unlevered and levered DCF valuation models tailored for Harbin Gloria Pharmaceuticals (002437SZ).
- WACC Calculator: Ready-to-use Weighted Average Cost of Capital template with adjustable parameters.
- Customizable Forecast Assumptions: Alter growth projections, capital expenditures, and discount rates as needed.
- Integrated Financial Ratios: Evaluate profitability, leverage, and efficiency ratios specifically for Harbin Gloria Pharmaceuticals (002437SZ).
- User-Friendly Dashboard and Charts: Visual representations of essential valuation metrics for streamlined analysis.
How It Works
- Step 1: Download the Excel file.
- Step 2: Examine the pre-filled data for Harbin Gloria Pharmaceuticals (002437SZ), including both historical and projected figures.
- Step 3: Modify key assumptions (highlighted in yellow) according to your own analysis.
- Step 4: Observe the automatic recalculations reflecting Harbin Gloria's intrinsic value.
- Step 5: Utilize the results for your investment strategies or financial reporting.
Why Choose This Calculator for Harbin Gloria Pharmaceuticals Co., Ltd (002437SZ)?
- All-in-One Solution: Features DCF, WACC, and comprehensive financial ratio analyses all in one platform.
- Flexible Inputs: Modify the highlighted fields to explore different scenarios tailored to your needs.
- In-Depth Analysis: Automatically computes the intrinsic value and Net Present Value for Harbin Gloria Pharmaceuticals.
- Preloaded Metrics: Access to both historical and forecasted data to ensure accurate analyses from the outset.
- Expert-Level Quality: Perfect for financial analysts, investors, and business consultants focused on (002437SZ).
Who Should Utilize This Product?
- Investors: Accurately assess the fair value of Harbin Gloria Pharmaceuticals (002437SZ) prior to making investment choices.
- CFOs: Employ a professional-grade DCF model for comprehensive financial reporting and analysis of (002437SZ).
- Consultants: Swiftly customize the template for valuation reports tailored to clients focused on (002437SZ).
- Entrepreneurs: Acquire insights into financial modeling practices utilized by leading pharmaceutical companies.
- Educators: Utilize this resource as a teaching tool to illustrate valuation methodologies relevant to (002437SZ).
What the Template Includes
- Historical Data: Contains Harbin Gloria Pharmaceuticals' past financial performance and foundational forecasts.
- DCF and Levered DCF Models: Comprehensive templates to determine the intrinsic value of Harbin Gloria Pharmaceuticals.
- WACC Sheet: Built-in calculations for the Weighted Average Cost of Capital.
- Editable Inputs: Adjust critical components such as growth rates, EBITDA percentages, and CAPEX assumptions.
- Quarterly and Annual Statements: An exhaustive overview of Harbin Gloria Pharmaceuticals' financial data.
- Interactive Dashboard: Dynamically visualize valuation outcomes and future projections.
Disclaimer
All information, articles, and product details provided on this website are for general informational and educational purposes only. We do not claim any ownership over, nor do we intend to infringe upon, any trademarks, copyrights, logos, brand names, or other intellectual property mentioned or depicted on this site. Such intellectual property remains the property of its respective owners, and any references here are made solely for identification or informational purposes, without implying any affiliation, endorsement, or partnership.
We make no representations or warranties, express or implied, regarding the accuracy, completeness, or suitability of any content or products presented. Nothing on this website should be construed as legal, tax, investment, financial, medical, or other professional advice. In addition, no part of this site—including articles or product references—constitutes a solicitation, recommendation, endorsement, advertisement, or offer to buy or sell any securities, franchises, or other financial instruments, particularly in jurisdictions where such activity would be unlawful.
All content is of a general nature and may not address the specific circumstances of any individual or entity. It is not a substitute for professional advice or services. Any actions you take based on the information provided here are strictly at your own risk. You accept full responsibility for any decisions or outcomes arising from your use of this website and agree to release us from any liability in connection with your use of, or reliance upon, the content or products found herein.