
|
Zhejiang Runtu Co., Ltd. (002440.sz) DCF Valoración |
Completamente Editable: Adáptelo A Sus Necesidades En Excel O Sheets
Diseño Profesional: Plantillas Confiables Y Estándares De La Industria
Predeterminadas Para Un Uso Rápido Y Eficiente
Compatible con MAC / PC, completamente desbloqueado
No Se Necesita Experiencia; Fáciles De Seguir
Zhejiang Runtu Co., Ltd. (002440.SZ) Bundle
¡Obtenga información sobre su análisis de valoración de Zhejiang Runtu Co., Ltd. (002440SZ) utilizando nuestra calculadora DCF de vanguardia! Antes de datos reales (002440SZ), esta plantilla de Excel le permite ajustar preventos y supuestos para determinar con precisión el valor intrínseco de Zhejiang Runtu Co., Ltd.
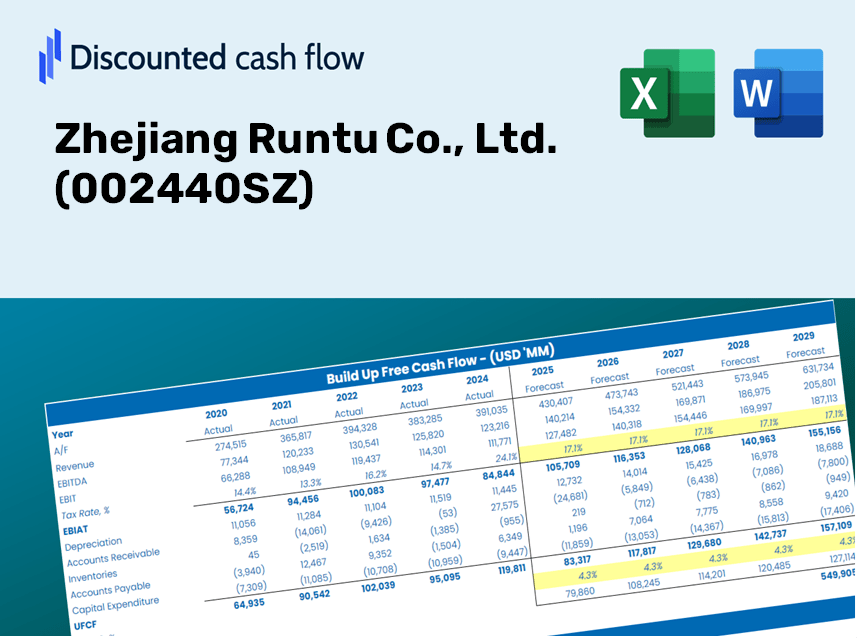
Discounted Cash Flow (DCF) - (USD MM)
| Year | AY1 2020 |
AY2 2021 |
AY3 2022 |
AY4 2023 |
AY5 2024 |
FY1 2025 |
FY2 2026 |
FY3 2027 |
FY4 2028 |
FY5 2029 |
|---|---|---|---|---|---|---|---|---|---|---|
| Revenue | 5,228.1 | 5,572.3 | 6,268.0 | 5,588.5 | 5,695.2 | 5,839.5 | 5,987.5 | 6,139.2 | 6,294.8 | 6,454.3 |
| Revenue Growth, % | 0 | 6.58 | 12.49 | -10.84 | 1.91 | 2.53 | 2.53 | 2.53 | 2.53 | 2.53 |
| EBITDA | 1,046.0 | 1,090.7 | 895.2 | 585.3 | 794.9 | 914.4 | 937.6 | 961.3 | 985.7 | 1,010.7 |
| EBITDA, % | 20.01 | 19.57 | 14.28 | 10.47 | 13.96 | 15.66 | 15.66 | 15.66 | 15.66 | 15.66 |
| Depreciation | 441.0 | 443.6 | 458.3 | 485.5 | 466.8 | 474.0 | 486.0 | 498.4 | 511.0 | 523.9 |
| Depreciation, % | 8.43 | 7.96 | 7.31 | 8.69 | 8.2 | 8.12 | 8.12 | 8.12 | 8.12 | 8.12 |
| EBIT | 605.1 | 647.1 | 436.9 | 99.8 | 328.1 | 440.4 | 451.5 | 463.0 | 474.7 | 486.7 |
| EBIT, % | 11.57 | 11.61 | 6.97 | 1.79 | 5.76 | 7.54 | 7.54 | 7.54 | 7.54 | 7.54 |
| Total Cash | 2,289.4 | 1,664.0 | 2,233.6 | 1,859.9 | 1,625.7 | 1,998.4 | 2,049.1 | 2,101.0 | 2,154.2 | 2,208.8 |
| Total Cash, percent | .0 | .0 | .0 | .0 | .0 | .0 | .0 | .0 | .0 | .0 |
| Account Receivables | 2,699.6 | 2,281.5 | 2,423.5 | 2,417.1 | 2,626.8 | 2,576.6 | 2,641.9 | 2,708.8 | 2,777.5 | 2,847.9 |
| Account Receivables, % | 51.64 | 40.94 | 38.67 | 43.25 | 46.12 | 44.12 | 44.12 | 44.12 | 44.12 | 44.12 |
| Inventories | 1,024.9 | 1,103.2 | 1,458.7 | 1,535.1 | 1,597.5 | 1,380.4 | 1,415.4 | 1,451.2 | 1,488.0 | 1,525.7 |
| Inventories, % | 19.6 | 19.8 | 23.27 | 27.47 | 28.05 | 23.64 | 23.64 | 23.64 | 23.64 | 23.64 |
| Accounts Payable | 1,027.0 | 847.1 | 1,358.4 | 844.5 | 977.4 | 1,037.0 | 1,063.3 | 1,090.2 | 1,117.8 | 1,146.2 |
| Accounts Payable, % | 19.64 | 15.2 | 21.67 | 15.11 | 17.16 | 17.76 | 17.76 | 17.76 | 17.76 | 17.76 |
| Capital Expenditure | -120.2 | -252.4 | -196.1 | -121.4 | -88.8 | -159.9 | -163.9 | -168.1 | -172.3 | -176.7 |
| Capital Expenditure, % | -2.3 | -4.53 | -3.13 | -2.17 | -1.56 | -2.74 | -2.74 | -2.74 | -2.74 | -2.74 |
| Tax Rate, % | 42.24 | 42.24 | 42.24 | 42.24 | 42.24 | 42.24 | 42.24 | 42.24 | 42.24 | 42.24 |
| EBITAT | 514.2 | 524.7 | 318.4 | 29.4 | 189.5 | 287.2 | 294.5 | 302.0 | 309.6 | 317.5 |
| Depreciation | ||||||||||
| Changes in Account Receivables | ||||||||||
| Changes in Inventories | ||||||||||
| Changes in Accounts Payable | ||||||||||
| Capital Expenditure | ||||||||||
| UFCF | -1,862.4 | 875.7 | 594.3 | -190.4 | 428.3 | 928.3 | 542.6 | 556.4 | 570.5 | 585.0 |
| WACC, % | 5.52 | 5.51 | 5.49 | 5.37 | 5.45 | 5.47 | 5.47 | 5.47 | 5.47 | 5.47 |
| PV UFCF | ||||||||||
| SUM PV UFCF | 2,751.7 | |||||||||
| Long Term Growth Rate, % | 2.00 | |||||||||
| Free cash flow (T + 1) | 597 | |||||||||
| Terminal Value | 17,212 | |||||||||
| Present Terminal Value | 13,191 | |||||||||
| Enterprise Value | 15,943 | |||||||||
| Net Debt | -1,182 | |||||||||
| Equity Value | 17,125 | |||||||||
| Diluted Shares Outstanding, MM | 1,124 | |||||||||
| Equity Value Per Share | 15.24 |
Benefits You'll Receive
- Pre-Loaded Financial Model: Utilize Zhejiang Runtu's actual data for accurate DCF valuation.
- Comprehensive Forecast Control: Modify revenue growth, margins, WACC, and other essential parameters.
- Real-Time Calculations: Automatic updates provide instant insights as you adjust inputs.
- Professional-Grade Template: An elegant Excel file crafted for high-quality valuation.
- Customizable and Versatile: Designed for adaptability, allowing for repeated use in detailed forecasting.
Key Features
- Authentic Runtu Data: Pre-populated with Zhejiang Runtu's historical financial performance and future projections.
- Highly Customizable Parameters: Modify revenue growth rates, profit margins, WACC, tax rates, and capital expenditure assumptions.
- Adaptive Valuation Framework: Instant updates to Net Present Value (NPV) and intrinsic value reflecting your adjustments.
- Strategic Scenario Analysis: Develop various forecasting scenarios to evaluate different valuation possibilities.
- Intuitive User Interface: Streamlined and organized, catering to both industry professionals and newcomers.
How It Functions
- 1. Access the Template: Download and open the Excel file featuring Zhejiang Runtu Co., Ltd.'s preloaded data.
- 2. Modify Assumptions: Adjust critical inputs such as growth rates, WACC, and capital expenditures.
- 3. View Real-time Results: The DCF model automatically computes intrinsic value and NPV based on your inputs.
- 4. Explore Different Scenarios: Analyze various forecasts to understand different valuation possibilities.
- 5. Present with Assurance: Deliver professional valuation insights that support your decision-making process.
Why Opt for This Calculator?
- Precise Financials: Leverage actual Zhejiang Runtu Co., Ltd. (002440SZ) data for trustworthy valuation outcomes.
- Tailored Settings: Modify essential parameters such as growth rates, WACC, and tax rates to fit your forecasts.
- Efficiency Boost: Built-in calculations save you the hassle of starting from the ground up.
- Professional Quality: Crafted for investors, analysts, and consultants alike.
- Easy to Navigate: User-friendly design and clear, step-by-step guidance cater to users of all experience levels.
Who Should Benefit from This Product?
- Institutional Investors: Develop comprehensive and trustworthy valuation models for analyzing portfolios involving Zhejiang Runtu Co., Ltd. (002440SZ).
- Finance Departments: Assess valuation scenarios to inform corporate strategies for Zhejiang Runtu Co., Ltd. (002440SZ).
- Financial Consultants and Advisors: Deliver precise valuation insights to clients considering investments in Zhejiang Runtu Co., Ltd. (002440SZ).
- Students and Academic Professionals: Leverage real-world data for practical application and education in financial modeling, focusing on Zhejiang Runtu Co., Ltd. (002440SZ).
- Market Analysts: Gain insights into how companies like Zhejiang Runtu Co., Ltd. (002440SZ) are valued within the industry.
Contents of the Template
- Preloaded Runtu Data: Historical and projected financial metrics, including revenue, EBIT, and capital expenditures.
- DCF and WACC Models: Professional-grade spreadsheets for determining intrinsic value and Weighted Average Cost of Capital.
- Editable Inputs: Yellow-highlighted cells designed for modifying revenue growth, tax rates, and discount rates.
- Financial Statements: Detailed annual and quarterly financial reports for in-depth analysis.
- Key Ratios: Profitability, leverage, and efficiency ratios to assess performance.
- Dashboard and Charts: Visual representations summarizing valuation results and underlying assumptions.
Disclaimer
All information, articles, and product details provided on this website are for general informational and educational purposes only. We do not claim any ownership over, nor do we intend to infringe upon, any trademarks, copyrights, logos, brand names, or other intellectual property mentioned or depicted on this site. Such intellectual property remains the property of its respective owners, and any references here are made solely for identification or informational purposes, without implying any affiliation, endorsement, or partnership.
We make no representations or warranties, express or implied, regarding the accuracy, completeness, or suitability of any content or products presented. Nothing on this website should be construed as legal, tax, investment, financial, medical, or other professional advice. In addition, no part of this site—including articles or product references—constitutes a solicitation, recommendation, endorsement, advertisement, or offer to buy or sell any securities, franchises, or other financial instruments, particularly in jurisdictions where such activity would be unlawful.
All content is of a general nature and may not address the specific circumstances of any individual or entity. It is not a substitute for professional advice or services. Any actions you take based on the information provided here are strictly at your own risk. You accept full responsibility for any decisions or outcomes arising from your use of this website and agree to release us from any liability in connection with your use of, or reliance upon, the content or products found herein.