
|
Foshan NationStar Optoelectronics Co., Ltd (002449.sz) DCF Valoración |
Completamente Editable: Adáptelo A Sus Necesidades En Excel O Sheets
Diseño Profesional: Plantillas Confiables Y Estándares De La Industria
Predeterminadas Para Un Uso Rápido Y Eficiente
Compatible con MAC / PC, completamente desbloqueado
No Se Necesita Experiencia; Fáciles De Seguir
Foshan NationStar Optoelectronics Co.,Ltd (002449.SZ) Bundle
¡Simplifique la valoración de Foshan NationStar Optoelectronics Co., Ltd (002449sz) con esta calculadora DCF personalizable! Con el verdadero Foshan NationStar Financials y los aportes de pronóstico ajustables, puede probar escenarios y descubrir el valor razonable de Foshan NationStar en minutos.
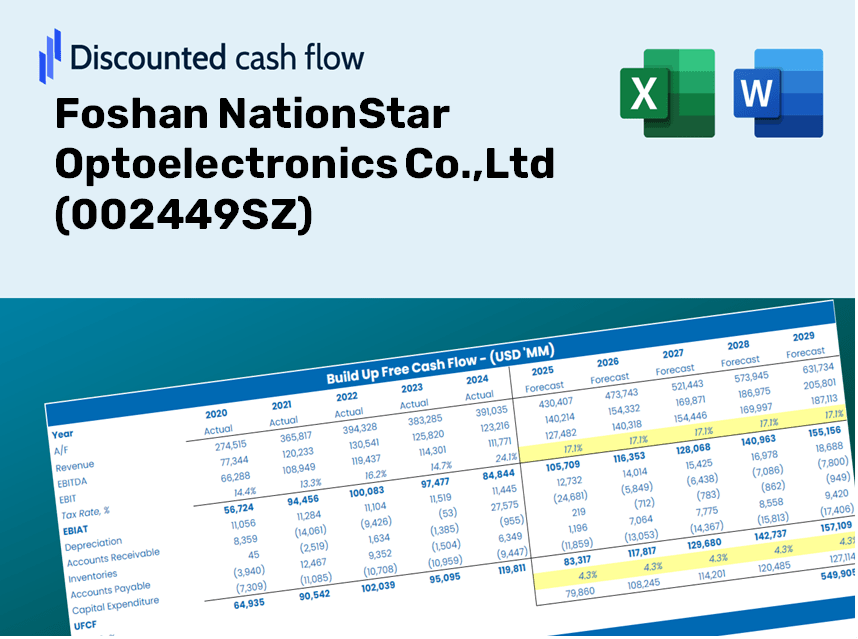
Discounted Cash Flow (DCF) - (USD MM)
| Year | AY1 2020 |
AY2 2021 |
AY3 2022 |
AY4 2023 |
AY5 2024 |
FY1 2025 |
FY2 2026 |
FY3 2027 |
FY4 2028 |
FY5 2029 |
|---|---|---|---|---|---|---|---|---|---|---|
| Revenue | 3,263.3 | 3,806.3 | 3,579.9 | 3,541.6 | 3,472.9 | 3,539.6 | 3,607.5 | 3,676.8 | 3,747.4 | 3,819.4 |
| Revenue Growth, % | 0 | 16.64 | -5.95 | -1.07 | -1.94 | 1.92 | 1.92 | 1.92 | 1.92 | 1.92 |
| EBITDA | 420.7 | 615.3 | 512.0 | 477.7 | 417.0 | 487.4 | 496.8 | 506.4 | 516.1 | 526.0 |
| EBITDA, % | 12.89 | 16.17 | 14.3 | 13.49 | 12.01 | 13.77 | 13.77 | 13.77 | 13.77 | 13.77 |
| Depreciation | 327.9 | 351.7 | 375.9 | 380.6 | 351.0 | 358.5 | 365.4 | 372.4 | 379.5 | 386.8 |
| Depreciation, % | 10.05 | 9.24 | 10.5 | 10.75 | 10.11 | 10.13 | 10.13 | 10.13 | 10.13 | 10.13 |
| EBIT | 92.8 | 263.6 | 136.2 | 97.2 | 66.1 | 129.0 | 131.4 | 134.0 | 136.5 | 139.2 |
| EBIT, % | 2.84 | 6.92 | 3.8 | 2.74 | 1.9 | 3.64 | 3.64 | 3.64 | 3.64 | 3.64 |
| Total Cash | 724.3 | 1,017.7 | 1,504.7 | 1,515.3 | 1,403.8 | 1,233.0 | 1,256.7 | 1,280.8 | 1,305.4 | 1,330.5 |
| Total Cash, percent | .0 | .0 | .0 | .0 | .0 | .0 | .0 | .0 | .0 | .0 |
| Account Receivables | 1,596.7 | 1,703.9 | 1,320.4 | 1,464.3 | 1,477.6 | 1,518.3 | 1,547.4 | 1,577.2 | 1,607.4 | 1,638.3 |
| Account Receivables, % | 48.93 | 44.77 | 36.88 | 41.35 | 42.55 | 42.89 | 42.89 | 42.89 | 42.89 | 42.89 |
| Inventories | 909.4 | 905.0 | 931.2 | 947.8 | 916.3 | 926.0 | 943.8 | 961.9 | 980.4 | 999.2 |
| Inventories, % | 27.87 | 23.78 | 26.01 | 26.76 | 26.38 | 26.16 | 26.16 | 26.16 | 26.16 | 26.16 |
| Accounts Payable | 1,703.1 | 2,172.4 | 1,711.9 | 803.4 | 1,694.7 | 1,618.0 | 1,649.1 | 1,680.8 | 1,713.1 | 1,746.0 |
| Accounts Payable, % | 52.19 | 57.07 | 47.82 | 22.68 | 48.8 | 45.71 | 45.71 | 45.71 | 45.71 | 45.71 |
| Capital Expenditure | -455.7 | -308.6 | -383.9 | -219.6 | -201.8 | -317.2 | -323.3 | -329.5 | -335.8 | -342.2 |
| Capital Expenditure, % | -13.96 | -8.11 | -10.72 | -6.2 | -5.81 | -8.96 | -8.96 | -8.96 | -8.96 | -8.96 |
| Tax Rate, % | -4.74 | -4.74 | -4.74 | -4.74 | -4.74 | -4.74 | -4.74 | -4.74 | -4.74 | -4.74 |
| EBITAT | 109.4 | 263.1 | 126.8 | 101.3 | 69.2 | 127.1 | 129.6 | 132.1 | 134.6 | 137.2 |
| Depreciation | ||||||||||
| Changes in Account Receivables | ||||||||||
| Changes in Inventories | ||||||||||
| Changes in Accounts Payable | ||||||||||
| Capital Expenditure | ||||||||||
| UFCF | -821.5 | 672.6 | 15.8 | -806.8 | 1,127.9 | 41.5 | 155.8 | 158.8 | 161.9 | 165.0 |
| WACC, % | 8.65 | 8.65 | 8.63 | 8.65 | 8.65 | 8.65 | 8.65 | 8.65 | 8.65 | 8.65 |
| PV UFCF | ||||||||||
| SUM PV UFCF | 519.1 | |||||||||
| Long Term Growth Rate, % | 3.50 | |||||||||
| Free cash flow (T + 1) | 171 | |||||||||
| Terminal Value | 3,316 | |||||||||
| Present Terminal Value | 2,191 | |||||||||
| Enterprise Value | 2,710 | |||||||||
| Net Debt | -1,016 | |||||||||
| Equity Value | 3,726 | |||||||||
| Diluted Shares Outstanding, MM | 618 | |||||||||
| Equity Value Per Share | 6.02 |
What You Will Receive
- Authentic NationStar Data: Preloaded metrics – from revenue to EBIT – derived from actual and forecasted figures.
- Comprehensive Customization: Modify all essential parameters (yellow cells) such as WACC, growth rate, and tax percentages.
- Immediate Valuation Adjustments: Automatic recalculations to evaluate the effect of changes on NationStar’s fair value.
- Flexible Excel Template: Designed for rapid adjustments, scenario analysis, and thorough projections.
- Efficient and Accurate: Eliminate the need to construct models from scratch while ensuring precision and adaptability.
Key Features
- 🔍 Real-Life NationStar Financials: Pre-filled historical and projected data for Foshan NationStar Optoelectronics Co., Ltd (002449SZ).
- ✏️ Fully Customizable Inputs: Modify all essential parameters (yellow cells) such as WACC, growth %, and tax rates.
- 📊 Professional DCF Valuation: Integrated formulas compute NationStar’s intrinsic value via the Discounted Cash Flow method.
- ⚡ Instant Results: Visualize NationStar’s valuation immediately after making adjustments.
- Scenario Analysis: Evaluate and compare different outcomes based on various financial assumptions side-by-side.
How It Works
- Download the Template: Gain immediate access to the Excel-based Foshan NationStar Optoelectronics DCF Calculator.
- Input Your Assumptions: Modify the yellow-highlighted cells for growth rates, WACC, margins, and more.
- Instant Calculations: The model automatically recalculates the intrinsic value of Foshan NationStar (002449SZ).
- Test Scenarios: Experiment with various assumptions to assess potential changes in valuation.
- Analyze and Decide: Utilize the results to inform your investment or financial analysis decisions.
Why Opt for This Calculator?
- All-in-One Solution: Combines DCF, WACC, and financial ratio analyses tailored for Foshan NationStar Optoelectronics Co., Ltd (002449SZ).
- Flexible Inputs: Modify the highlighted cells to evaluate different financial scenarios.
- In-Depth Analysis: Automatically computes the intrinsic value and Net Present Value for Foshan NationStar (002449SZ).
- Preloaded Information: Comprehensive historical and projected data provide reliable foundations for analysis.
- High-Quality Standards: Perfect for financial analysts, investors, and business consultants focusing on Foshan NationStar (002449SZ).
Who Should Use This Product?
- Individual Investors: Gain insights for making informed choices regarding buying or selling Foshan NationStar Optoelectronics Co., Ltd (002449SZ) stock.
- Financial Analysts: Enhance valuation workflows with comprehensive financial models tailored for Foshan NationStar Optoelectronics Co., Ltd (002449SZ).
- Consultants: Provide clients with swift and accurate valuation analyses for Foshan NationStar Optoelectronics Co., Ltd (002449SZ).
- Business Owners: Learn how large firms like Foshan NationStar Optoelectronics Co., Ltd (002449SZ) are valued to inform your own business strategies.
- Finance Students: Explore valuation methodologies using real data and scenarios related to Foshan NationStar Optoelectronics Co., Ltd (002449SZ).
Contents of the Template
- Pre-Populated Information: Contains historical financials and projections for Foshan NationStar Optoelectronics Co.,Ltd (002449SZ).
- Discounted Cash Flow Model: An editable DCF valuation model with automated calculations.
- Weighted Average Cost of Capital (WACC): A specific sheet for computing WACC based on your inputs.
- Essential Financial Ratios: Examine Foshan NationStar's profitability, efficiency, and leverage metrics.
- Adjustable Inputs: Easily modify revenue growth, profit margins, and tax rates.
- User-Friendly Dashboard: Visuals and tables presenting key valuation findings.
Disclaimer
All information, articles, and product details provided on this website are for general informational and educational purposes only. We do not claim any ownership over, nor do we intend to infringe upon, any trademarks, copyrights, logos, brand names, or other intellectual property mentioned or depicted on this site. Such intellectual property remains the property of its respective owners, and any references here are made solely for identification or informational purposes, without implying any affiliation, endorsement, or partnership.
We make no representations or warranties, express or implied, regarding the accuracy, completeness, or suitability of any content or products presented. Nothing on this website should be construed as legal, tax, investment, financial, medical, or other professional advice. In addition, no part of this site—including articles or product references—constitutes a solicitation, recommendation, endorsement, advertisement, or offer to buy or sell any securities, franchises, or other financial instruments, particularly in jurisdictions where such activity would be unlawful.
All content is of a general nature and may not address the specific circumstances of any individual or entity. It is not a substitute for professional advice or services. Any actions you take based on the information provided here are strictly at your own risk. You accept full responsibility for any decisions or outcomes arising from your use of this website and agree to release us from any liability in connection with your use of, or reliance upon, the content or products found herein.