
|
Yotrio Group Co., Ltd. (002489.sz) Valoración de DCF |
Completamente Editable: Adáptelo A Sus Necesidades En Excel O Sheets
Diseño Profesional: Plantillas Confiables Y Estándares De La Industria
Predeterminadas Para Un Uso Rápido Y Eficiente
Compatible con MAC / PC, completamente desbloqueado
No Se Necesita Experiencia; Fáciles De Seguir
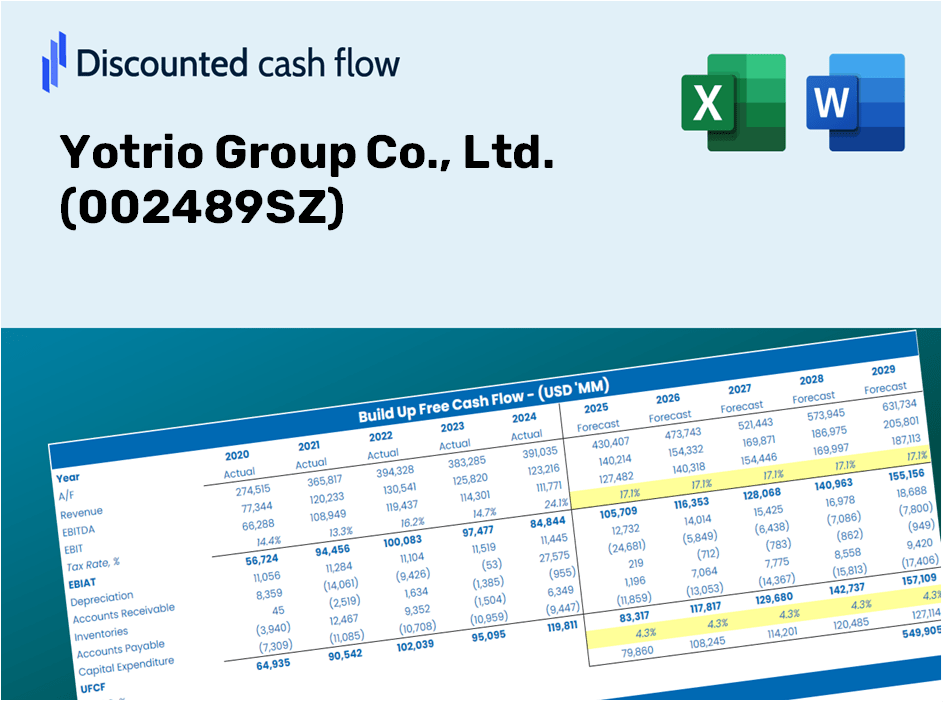
Yotrio Group Co., Ltd. (002489.SZ) Bundle
¡Evalúe las perspectivas financieras de Yotrio Group Co., Ltd. como un experto! Esta calculadora DCF (002489SZ) proporciona datos financieros preconsados junto con la flexibilidad para modificar el crecimiento de los ingresos, WACC, los márgenes y otros supuestos esenciales para alinearse con sus predicciones.
Discounted Cash Flow (DCF) - (USD MM)
| Year | AY1 2020 |
AY2 2021 |
AY3 2022 |
AY4 2023 |
AY5 2024 |
FY1 2025 |
FY2 2026 |
FY3 2027 |
FY4 2028 |
FY5 2029 |
|---|---|---|---|---|---|---|---|---|---|---|
| Revenue | 4,954.6 | 8,150.8 | 8,219.1 | 4,837.3 | 5,675.5 | 5,886.6 | 6,105.6 | 6,332.7 | 6,568.2 | 6,812.5 |
| Revenue Growth, % | 0 | 64.51 | 0.83797 | -41.15 | 17.33 | 3.72 | 3.72 | 3.72 | 3.72 | 3.72 |
| EBITDA | 599.6 | 148.8 | 395.8 | 281.4 | 263.3 | 343.7 | 356.5 | 369.8 | 383.5 | 397.8 |
| EBITDA, % | 12.1 | 1.83 | 4.82 | 5.82 | 4.64 | 5.84 | 5.84 | 5.84 | 5.84 | 5.84 |
| Depreciation | 119.4 | 115.4 | 114.3 | 155.6 | 110.1 | 122.1 | 126.7 | 131.4 | 136.3 | 141.3 |
| Depreciation, % | 2.41 | 1.42 | 1.39 | 3.22 | 1.94 | 2.07 | 2.07 | 2.07 | 2.07 | 2.07 |
| EBIT | 480.1 | 33.4 | 281.5 | 125.8 | 153.2 | 221.6 | 229.9 | 238.4 | 247.3 | 256.5 |
| EBIT, % | 9.69 | 0.41002 | 3.42 | 2.6 | 2.7 | 3.76 | 3.76 | 3.76 | 3.76 | 3.76 |
| Total Cash | 1,521.8 | 2,033.6 | 1,908.4 | 1,785.3 | 1,446.8 | 1,663.3 | 1,725.2 | 1,789.4 | 1,855.9 | 1,925.0 |
| Total Cash, percent | .0 | .0 | .0 | .0 | .0 | .0 | .0 | .0 | .0 | .0 |
| Account Receivables | 1,287.6 | 2,225.7 | 2,269.2 | 1,501.5 | 2,210.6 | 1,776.5 | 1,842.6 | 1,911.1 | 1,982.2 | 2,055.9 |
| Account Receivables, % | 25.99 | 27.31 | 27.61 | 31.04 | 38.95 | 30.18 | 30.18 | 30.18 | 30.18 | 30.18 |
| Inventories | 1,598.7 | 2,362.9 | 1,676.3 | 1,207.8 | 1,525.2 | 1,571.6 | 1,630.1 | 1,690.7 | 1,753.6 | 1,818.9 |
| Inventories, % | 32.27 | 28.99 | 20.4 | 24.97 | 26.87 | 26.7 | 26.7 | 26.7 | 26.7 | 26.7 |
| Accounts Payable | 1,929.2 | 3,638.9 | 2,165.3 | 1,515.8 | 2,387.7 | 2,158.4 | 2,238.7 | 2,322.0 | 2,408.4 | 2,497.9 |
| Accounts Payable, % | 38.94 | 44.65 | 26.34 | 31.34 | 42.07 | 36.67 | 36.67 | 36.67 | 36.67 | 36.67 |
| Capital Expenditure | -107.0 | -150.1 | -133.7 | -174.7 | -146.3 | -139.1 | -144.3 | -149.7 | -155.2 | -161.0 |
| Capital Expenditure, % | -2.16 | -1.84 | -1.63 | -3.61 | -2.58 | -2.36 | -2.36 | -2.36 | -2.36 | -2.36 |
| Tax Rate, % | 12.84 | 12.84 | 12.84 | 12.84 | 12.84 | 12.84 | 12.84 | 12.84 | 12.84 | 12.84 |
| EBITAT | 383.1 | 29.6 | 296.3 | 69.0 | 133.5 | 181.9 | 188.6 | 195.7 | 202.9 | 210.5 |
| Depreciation | ||||||||||
| Changes in Account Receivables | ||||||||||
| Changes in Inventories | ||||||||||
| Changes in Accounts Payable | ||||||||||
| Capital Expenditure | ||||||||||
| UFCF | -561.6 | 2.4 | -553.6 | 636.7 | -57.5 | 323.3 | 126.8 | 131.5 | 136.4 | 141.4 |
| WACC, % | 4.34 | 4.38 | 4.44 | 4.23 | 4.38 | 4.36 | 4.36 | 4.36 | 4.36 | 4.36 |
| PV UFCF | ||||||||||
| SUM PV UFCF | 771.1 | |||||||||
| Long Term Growth Rate, % | 3.50 | |||||||||
| Free cash flow (T + 1) | 146 | |||||||||
| Terminal Value | 17,115 | |||||||||
| Present Terminal Value | 13,829 | |||||||||
| Enterprise Value | 14,600 | |||||||||
| Net Debt | 361 | |||||||||
| Equity Value | 14,239 | |||||||||
| Diluted Shares Outstanding, MM | 2,200 | |||||||||
| Equity Value Per Share | 6.47 |
What You'll Receive
- Adjustable Forecast Parameters: Seamlessly modify key inputs (growth %, margins, WACC) to explore various scenarios.
- Real-Time Market Data: Yotrio Group Co., Ltd.’s financial information pre-loaded to enhance your analysis.
- Automated DCF Calculations: The template computes Net Present Value (NPV) and intrinsic value automatically.
- Customizable and Professional Design: A sophisticated Excel model tailored to fit your valuation requirements.
- Designed for Analysts and Investors: Perfect for evaluating projections, verifying strategies, and increasing efficiency.
Highlighted Features
- Comprehensive Data: Yotrio Group Co., Ltd.'s historical financial records along with pre-set forecasts.
- Customizable Parameters: Adjust WACC, tax rates, revenue growth, and EBITDA margins as needed.
- Real-Time Insights: Monitor Yotrio's intrinsic value update instantly.
- Visual Clarity: Interactive dashboard charts present valuation outcomes and essential metrics.
- Designed for Precision: A sophisticated tool tailored for analysts, investors, and financial professionals.
How It Works
- Step 1: Download the Excel file.
- Step 2: Examine the pre-filled Yotrio Group data (both historical and projected).
- Step 3: Modify key assumptions (highlighted in yellow) according to your analysis.
- Step 4: Observe the automatic updates for Yotrio Group's intrinsic value.
- Step 5: Utilize the results for your investment decisions or financial reporting.
Why Opt for the Yotrio Group Financial Calculator?
- All-in-One Solution: Combines DCF, WACC, and financial ratio analyses for comprehensive evaluations.
- Flexible Input Options: Modify the highlighted cells to explore different financial scenarios.
- In-Depth Analysis: Automatically computes the intrinsic value and Net Present Value for Yotrio Group (002489SZ).
- Preloaded Analytics: Provides historical and projected data for reliable analyses.
- Expert-Level Functionality: Perfect for financial analysts, investors, and business advisors.
Who Can Benefit from This Product?
- Investors: Evaluate Yotrio Group Co., Ltd.'s (002489SZ) valuation before making buy or sell decisions.
- CFOs and Financial Analysts: Optimize valuation workflows and challenge financial forecasts.
- Startup Founders: Gain insights into how established public companies like Yotrio Group Co., Ltd. are appraised.
- Consultants: Provide clients with comprehensive valuation reports on Yotrio Group Co., Ltd. (002489SZ).
- Students and Educators: Utilize real data to develop and teach valuation skills related to Yotrio Group Co., Ltd.
What the Template Contains
- Historical Data: Provides Yotrio Group Co., Ltd.'s (002489SZ) past financials and foundational forecasts.
- DCF and Levered DCF Models: Comprehensive templates for assessing the intrinsic value of Yotrio Group Co., Ltd. (002489SZ).
- WACC Sheet: Ready-to-use calculations for the Weighted Average Cost of Capital.
- Editable Inputs: Customize essential drivers such as growth rates, EBITDA %, and CAPEX assumptions.
- Quarterly and Annual Statements: A thorough analysis of Yotrio Group Co., Ltd.'s (002489SZ) financial performance.
- Interactive Dashboard: Dynamically visualize valuation outcomes and forecasts.
Disclaimer
All information, articles, and product details provided on this website are for general informational and educational purposes only. We do not claim any ownership over, nor do we intend to infringe upon, any trademarks, copyrights, logos, brand names, or other intellectual property mentioned or depicted on this site. Such intellectual property remains the property of its respective owners, and any references here are made solely for identification or informational purposes, without implying any affiliation, endorsement, or partnership.
We make no representations or warranties, express or implied, regarding the accuracy, completeness, or suitability of any content or products presented. Nothing on this website should be construed as legal, tax, investment, financial, medical, or other professional advice. In addition, no part of this site—including articles or product references—constitutes a solicitation, recommendation, endorsement, advertisement, or offer to buy or sell any securities, franchises, or other financial instruments, particularly in jurisdictions where such activity would be unlawful.
All content is of a general nature and may not address the specific circumstances of any individual or entity. It is not a substitute for professional advice or services. Any actions you take based on the information provided here are strictly at your own risk. You accept full responsibility for any decisions or outcomes arising from your use of this website and agree to release us from any liability in connection with your use of, or reliance upon, the content or products found herein.