
|
Kuangda Technology Group Co., Ltd. (002516.sz) Valoración de DCF |
Completamente Editable: Adáptelo A Sus Necesidades En Excel O Sheets
Diseño Profesional: Plantillas Confiables Y Estándares De La Industria
Predeterminadas Para Un Uso Rápido Y Eficiente
Compatible con MAC / PC, completamente desbloqueado
No Se Necesita Experiencia; Fáciles De Seguir
Kuangda Technology Group Co., Ltd. (002516.SZ) Bundle
¡Agilice su análisis y mejore la precisión con nuestra calculadora DCF (002516SZ)! Utilizando datos reales de Kuangda Technology Group Co., Ltd. y suposiciones personalizables, esta herramienta le permite pronosticar, analizar y evaluar (002516SZ) como un inversor experimentado.
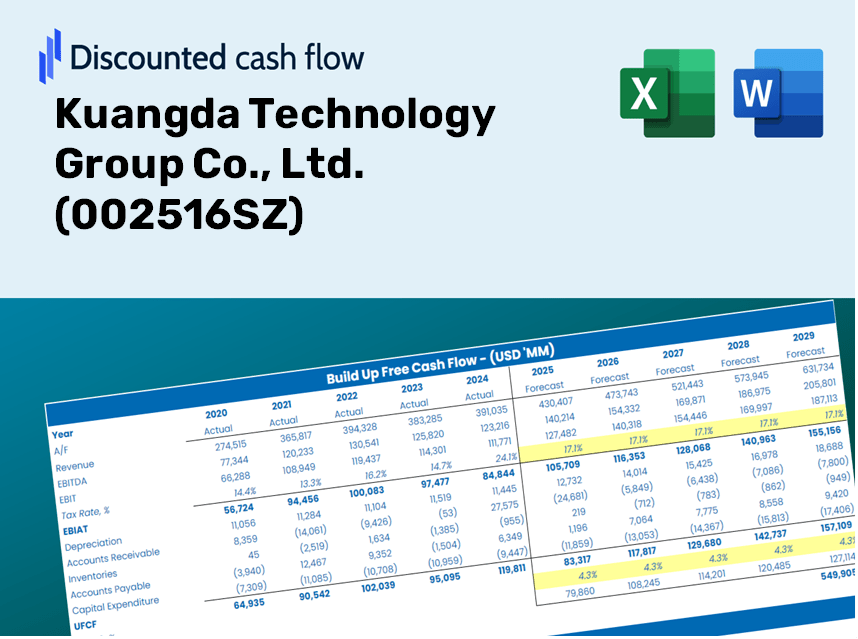
Discounted Cash Flow (DCF) - (USD MM)
| Year | AY1 2020 |
AY2 2021 |
AY3 2022 |
AY4 2023 |
AY5 2024 |
FY1 2025 |
FY2 2026 |
FY3 2027 |
FY4 2028 |
FY5 2029 |
|---|---|---|---|---|---|---|---|---|---|---|
| Revenue | 1,490.0 | 1,723.6 | 1,784.0 | 1,803.5 | 2,098.3 | 2,290.4 | 2,500.1 | 2,729.0 | 2,978.9 | 3,251.7 |
| Revenue Growth, % | 0 | 15.68 | 3.51 | 1.09 | 16.35 | 9.16 | 9.16 | 9.16 | 9.16 | 9.16 |
| EBITDA | 379.2 | 367.0 | 378.2 | 357.8 | 337.9 | 475.9 | 519.4 | 567.0 | 618.9 | 675.6 |
| EBITDA, % | 25.45 | 21.29 | 21.2 | 19.84 | 16.1 | 20.78 | 20.78 | 20.78 | 20.78 | 20.78 |
| Depreciation | 131.4 | 140.8 | 140.8 | 140.3 | 137.6 | 179.6 | 196.1 | 214.0 | 233.6 | 255.0 |
| Depreciation, % | 8.82 | 8.17 | 7.89 | 7.78 | 6.56 | 7.84 | 7.84 | 7.84 | 7.84 | 7.84 |
| EBIT | 247.9 | 226.2 | 237.4 | 217.5 | 200.3 | 296.2 | 323.4 | 353.0 | 385.3 | 420.6 |
| EBIT, % | 16.63 | 13.12 | 13.3 | 12.06 | 9.54 | 12.93 | 12.93 | 12.93 | 12.93 | 12.93 |
| Total Cash | 828.0 | 582.1 | 925.1 | 779.2 | 895.6 | 1,040.2 | 1,135.5 | 1,239.4 | 1,352.9 | 1,476.8 |
| Total Cash, percent | .0 | .0 | .0 | .0 | .0 | .0 | .0 | .0 | .0 | .0 |
| Account Receivables | 979.9 | 1,126.4 | 1,038.0 | 1,210.1 | 1,279.0 | 1,453.8 | 1,586.9 | 1,732.2 | 1,890.8 | 2,063.9 |
| Account Receivables, % | 65.77 | 65.35 | 58.18 | 67.1 | 60.96 | 63.47 | 63.47 | 63.47 | 63.47 | 63.47 |
| Inventories | 209.4 | 274.8 | 266.6 | 332.7 | 378.6 | 373.0 | 407.2 | 444.5 | 485.2 | 529.6 |
| Inventories, % | 14.05 | 15.94 | 14.95 | 18.45 | 18.04 | 16.29 | 16.29 | 16.29 | 16.29 | 16.29 |
| Accounts Payable | 384.1 | 438.1 | 435.1 | 540.0 | 591.8 | 612.6 | 668.7 | 729.9 | 796.7 | 869.7 |
| Accounts Payable, % | 25.78 | 25.42 | 24.39 | 29.94 | 28.2 | 26.75 | 26.75 | 26.75 | 26.75 | 26.75 |
| Capital Expenditure | -16.9 | -15.9 | -22.3 | -26.9 | -38.3 | -30.3 | -33.1 | -36.1 | -39.5 | -43.1 |
| Capital Expenditure, % | -1.14 | -0.92169 | -1.25 | -1.49 | -1.83 | -1.32 | -1.32 | -1.32 | -1.32 | -1.32 |
| Tax Rate, % | 15.97 | 15.97 | 15.97 | 15.97 | 15.97 | 15.97 | 15.97 | 15.97 | 15.97 | 15.97 |
| EBITAT | 207.2 | 190.5 | 201.0 | 196.3 | 168.3 | 252.9 | 276.0 | 301.3 | 328.9 | 359.0 |
| Depreciation | ||||||||||
| Changes in Account Receivables | ||||||||||
| Changes in Inventories | ||||||||||
| Changes in Accounts Payable | ||||||||||
| Capital Expenditure | ||||||||||
| UFCF | -483.5 | 157.4 | 413.0 | 176.5 | 204.7 | 253.7 | 327.8 | 357.8 | 390.6 | 426.3 |
| WACC, % | 6.39 | 6.39 | 6.39 | 6.39 | 6.39 | 6.39 | 6.39 | 6.39 | 6.39 | 6.39 |
| PV UFCF | ||||||||||
| SUM PV UFCF | 1,443.0 | |||||||||
| Long Term Growth Rate, % | 3.50 | |||||||||
| Free cash flow (T + 1) | 441 | |||||||||
| Terminal Value | 15,284 | |||||||||
| Present Terminal Value | 11,215 | |||||||||
| Enterprise Value | 12,658 | |||||||||
| Net Debt | -236 | |||||||||
| Equity Value | 12,894 | |||||||||
| Diluted Shares Outstanding, MM | 1,478 | |||||||||
| Equity Value Per Share | 8.72 |
What You Will Receive
- Accurate 002516SZ Financials: Access to both historical and projected data for precise valuation.
- Customizable Inputs: Easily adjust WACC, tax rates, revenue growth, and capital expenditures.
- Dynamic Calculations: Intrinsic value and NPV are updated in real-time.
- Comprehensive Scenario Analysis: Evaluate various scenarios to assess Kuangda Technology Group’s future potential.
- User-Friendly Design: Designed for professionals but user-friendly for newcomers.
Highlighted Features
- Comprehensive Kuangda Data: Comes pre-loaded with Kuangda Technology Group Co., Ltd.'s historical financial data and future estimates.
- Customizable Financial Inputs: Tailor revenue growth rates, profit margins, discount rates, tax percentages, and capital spending to your needs.
- Interactive Valuation Framework: Automatically recalculates Net Present Value (NPV) and intrinsic value based on user-defined parameters.
- Multiple Scenario Analysis: Develop various forecasting scenarios to evaluate different valuation possibilities.
- Intuitive User Interface: Easy-to-use layout that caters to both industry experts and novices.
How It Works
- Step 1: Download the Excel file.
- Step 2: Review the pre-filled Kuangda Technology Group Co., Ltd. (002516SZ) data (historical and projected).
- Step 3: Modify the key assumptions (yellow cells) based on your analysis.
- Step 4: Observe automatic recalculations for Kuangda Technology Group Co., Ltd.'s intrinsic value.
- Step 5: Utilize the results for investment decisions or reporting purposes.
Why Opt for This Calculator?
- User-Friendly: Crafted for both newcomers and seasoned users.
- Customizable Inputs: Easily adjust parameters to suit your analysis.
- Immediate Feedback: Witness real-time updates to Kuangda Technology Group’s valuation as you tweak the inputs.
- Pre-Configured: Comes with Kuangda Technology Group's actual financial data for swift assessments.
- Relied Upon by Experts: Utilized by investors and analysts for making well-informed choices.
Who Should Utilize Our Services?
- Finance Students: Master valuation techniques and apply them using real-world data from Kuangda Technology Group Co., Ltd. (002516SZ).
- Academics: Integrate professional valuation models into your coursework or research focusing on Kuangda Technology.
- Investors: Evaluate your investment strategies and analyze valuation results for Kuangda Technology Group Co., Ltd. (002516SZ).
- Analysts: Enhance your analysis process with a customizable DCF model tailored for Kuangda Technology.
- Small Business Owners: Discover insights into the valuation practices of large public companies like Kuangda Technology Group Co., Ltd. (002516SZ).
Contents of the Template
- Pre-Filled Data: Contains Kuangda Technology Group Co., Ltd.'s historical financials and projections.
- Discounted Cash Flow Model: An editable DCF valuation model featuring automatic computations.
- Weighted Average Cost of Capital (WACC): A specialized sheet for calculating WACC using customizable inputs.
- Key Financial Ratios: Evaluate Kuangda Technology Group Co., Ltd.'s profitability, efficiency, and financial leverage.
- Customizable Inputs: Easily modify assumptions for revenue growth, profit margins, and tax rates.
- Clear Dashboard: Visual summaries including charts and tables that highlight key valuation insights.
Disclaimer
All information, articles, and product details provided on this website are for general informational and educational purposes only. We do not claim any ownership over, nor do we intend to infringe upon, any trademarks, copyrights, logos, brand names, or other intellectual property mentioned or depicted on this site. Such intellectual property remains the property of its respective owners, and any references here are made solely for identification or informational purposes, without implying any affiliation, endorsement, or partnership.
We make no representations or warranties, express or implied, regarding the accuracy, completeness, or suitability of any content or products presented. Nothing on this website should be construed as legal, tax, investment, financial, medical, or other professional advice. In addition, no part of this site—including articles or product references—constitutes a solicitation, recommendation, endorsement, advertisement, or offer to buy or sell any securities, franchises, or other financial instruments, particularly in jurisdictions where such activity would be unlawful.
All content is of a general nature and may not address the specific circumstances of any individual or entity. It is not a substitute for professional advice or services. Any actions you take based on the information provided here are strictly at your own risk. You accept full responsibility for any decisions or outcomes arising from your use of this website and agree to release us from any liability in connection with your use of, or reliance upon, the content or products found herein.