
|
Feilong Auto Components Co., Ltd. (002536.sz) Valoración de DCF |
Completamente Editable: Adáptelo A Sus Necesidades En Excel O Sheets
Diseño Profesional: Plantillas Confiables Y Estándares De La Industria
Predeterminadas Para Un Uso Rápido Y Eficiente
Compatible con MAC / PC, completamente desbloqueado
No Se Necesita Experiencia; Fáciles De Seguir
Feilong Auto Components Co., Ltd. (002536.SZ) Bundle
¡Evalúe las perspectivas financieras de Feilong Auto Components Co., Ltd. como un experto! Esta calculadora DCF (002536SZ) proporciona datos financieros preconsados junto con la flexibilidad para modificar el crecimiento de los ingresos, WACC, los márgenes y otros supuestos críticos para alinearse con sus proyecciones.
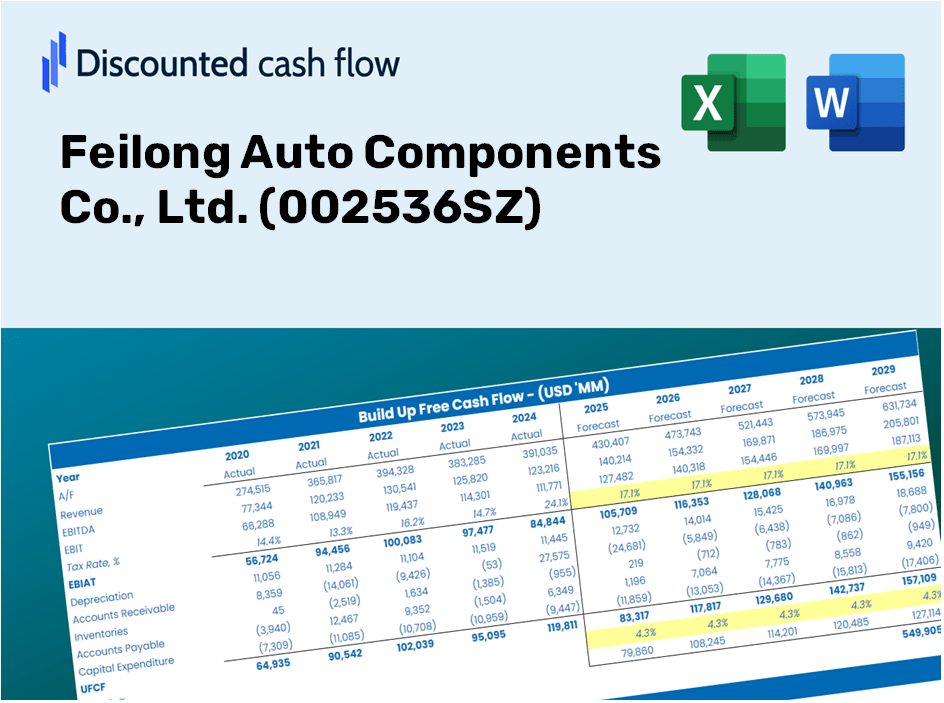
Discounted Cash Flow (DCF) - (USD MM)
| Year | AY1 2020 |
AY2 2021 |
AY3 2022 |
AY4 2023 |
AY5 2024 |
FY1 2025 |
FY2 2026 |
FY3 2027 |
FY4 2028 |
FY5 2029 |
|---|---|---|---|---|---|---|---|---|---|---|
| Revenue | 2,665.5 | 3,115.5 | 3,258.0 | 4,094.9 | 4,723.2 | 5,461.1 | 6,314.2 | 7,300.6 | 8,441.2 | 9,759.9 |
| Revenue Growth, % | 0 | 16.89 | 4.57 | 25.69 | 15.34 | 15.62 | 15.62 | 15.62 | 15.62 | 15.62 |
| EBITDA | 350.0 | 381.3 | 238.6 | 456.7 | 521.7 | 599.5 | 693.2 | 801.5 | 926.7 | 1,071.4 |
| EBITDA, % | 13.13 | 12.24 | 7.32 | 11.15 | 11.05 | 10.98 | 10.98 | 10.98 | 10.98 | 10.98 |
| Depreciation | 193.3 | 211.1 | 219.9 | 214.6 | 220.6 | 335.2 | 387.5 | 448.1 | 518.1 | 599.0 |
| Depreciation, % | 7.25 | 6.77 | 6.75 | 5.24 | 4.67 | 6.14 | 6.14 | 6.14 | 6.14 | 6.14 |
| EBIT | 156.8 | 170.2 | 18.7 | 242.1 | 301.1 | 264.3 | 305.6 | 353.4 | 408.6 | 472.4 |
| EBIT, % | 5.88 | 5.46 | 0.57252 | 5.91 | 6.37 | 4.84 | 4.84 | 4.84 | 4.84 | 4.84 |
| Total Cash | 256.7 | 314.2 | 371.5 | 894.8 | 818.7 | 767.9 | 887.8 | 1,026.5 | 1,186.9 | 1,372.3 |
| Total Cash, percent | .0 | .0 | .0 | .0 | .0 | .0 | .0 | .0 | .0 | .0 |
| Account Receivables | 842.3 | 809.2 | 862.7 | 884.7 | 1,309.8 | 1,456.9 | 1,684.5 | 1,947.7 | 2,252.0 | 2,603.8 |
| Account Receivables, % | 31.6 | 25.97 | 26.48 | 21.6 | 27.73 | 26.68 | 26.68 | 26.68 | 26.68 | 26.68 |
| Inventories | 631.3 | 859.6 | 950.0 | 1,057.9 | 748.5 | 1,333.8 | 1,542.1 | 1,783.0 | 2,061.6 | 2,383.6 |
| Inventories, % | 23.69 | 27.59 | 29.16 | 25.83 | 15.85 | 24.42 | 24.42 | 24.42 | 24.42 | 24.42 |
| Accounts Payable | 865.6 | 1,104.4 | 1,326.5 | 1,420.0 | 1,537.8 | 1,920.9 | 2,221.0 | 2,567.9 | 2,969.1 | 3,432.9 |
| Accounts Payable, % | 32.47 | 35.45 | 40.71 | 34.68 | 32.56 | 35.17 | 35.17 | 35.17 | 35.17 | 35.17 |
| Capital Expenditure | -127.4 | -115.7 | -59.6 | -95.3 | -280.4 | -203.0 | -234.7 | -271.4 | -313.8 | -362.8 |
| Capital Expenditure, % | -4.78 | -3.71 | -1.83 | -2.33 | -5.94 | -3.72 | -3.72 | -3.72 | -3.72 | -3.72 |
| Tax Rate, % | -1.5 | -1.5 | -1.5 | -1.5 | -1.5 | -1.5 | -1.5 | -1.5 | -1.5 | -1.5 |
| EBITAT | 163.6 | 230.5 | 34.1 | 265.8 | 305.6 | 264.3 | 305.6 | 353.4 | 408.6 | 472.4 |
| Depreciation | ||||||||||
| Changes in Account Receivables | ||||||||||
| Changes in Inventories | ||||||||||
| Changes in Accounts Payable | ||||||||||
| Capital Expenditure | ||||||||||
| UFCF | -378.6 | 369.5 | 272.6 | 348.8 | 248.0 | 47.2 | 322.6 | 373.0 | 431.2 | 498.6 |
| WACC, % | 5.04 | 5.04 | 5.04 | 5.04 | 5.04 | 5.04 | 5.04 | 5.04 | 5.04 | 5.04 |
| PV UFCF | ||||||||||
| SUM PV UFCF | 1,403.1 | |||||||||
| Long Term Growth Rate, % | 3.50 | |||||||||
| Free cash flow (T + 1) | 516 | |||||||||
| Terminal Value | 33,441 | |||||||||
| Present Terminal Value | 26,148 | |||||||||
| Enterprise Value | 27,551 | |||||||||
| Net Debt | -254 | |||||||||
| Equity Value | 27,805 | |||||||||
| Diluted Shares Outstanding, MM | 575 | |||||||||
| Equity Value Per Share | 48.38 |
What You Will Receive
- Authentic Feilong Data: Comprehensive financials – from revenue to EBIT – derived from actual and estimated figures.
- Complete Customization: Modify all essential parameters (yellow cells) such as WACC, growth %, and tax rates.
- Immediate Valuation Adjustments: Automatic recalculations to evaluate the effects of changes on Feilong’s fair value.
- Flexible Excel Template: Designed for easy modifications, scenario analysis, and in-depth projections.
- Efficient and Accurate: Avoid starting models from scratch while ensuring accuracy and adaptability.
Key Features
- Real-Time (002536SZ) Data: Comes pre-loaded with Feilong Auto Components’ historical performance metrics and future financial forecasts.
- Completely Customizable Parameters: Tailor revenue growth, profit margins, discount rates, tax percentages, and capital investment plans to fit your analysis.
- Responsive Valuation Framework: Automatically recalculates Net Present Value (NPV) and intrinsic value based on your customized inputs.
- Scenario Analysis: Develop various forecasting scenarios to evaluate multiple valuation possibilities.
- Intuitive Interface: Designed for ease of use, suitable for both seasoned professionals and newcomers.
How It Functions
- Download the Template: Gain immediate access to the Excel-based Feilong Auto DCF Calculator for [002536SZ].
- Input Your Assumptions: Modify the yellow-highlighted cells for growth rates, WACC, profit margins, and other parameters.
- Instant Calculations: The model automatically recalculates the intrinsic value of Feilong Auto Components.
- Test Scenarios: Experiment with various assumptions to assess potential changes in valuation.
- Analyze and Decide: Utilize the findings to inform your investment choices or financial assessments.
Why Opt for Feilong Auto Components Co., Ltd. (002536SZ) Calculator?
- Precision: Utilize authentic Feilong financials to guarantee data reliability.
- Adaptability: Crafted for users to effortlessly test and adjust inputs.
- Efficiency: Eliminate the need to create a financial model from the ground up.
- Expert-Quality: Engineered with the accuracy and usability expected at the CFO level.
- Intuitive: Simple to navigate, making it accessible even for those new to financial modeling.
Who Can Benefit from This Product?
- Investors: Assess the fair value of Feilong Auto Components Co., Ltd. (002536SZ) effectively before making investment choices.
- CFOs: Utilize a top-tier DCF model for accurate financial reporting and analysis.
- Consultants: Seamlessly customize the template for client valuation reports.
- Entrepreneurs: Discover financial modeling techniques employed by leading automotive companies.
- Educators: Implement it as a teaching resource to illustrate valuation methods.
What the Template Contains
- Historical Data: Contains Feilong Auto Components’ previous financial performance and baseline forecasts.
- DCF and Levered DCF Models: Comprehensive templates designed to assess the intrinsic value of Feilong Auto Components.
- WACC Sheet: Pre-configured calculations for the Weighted Average Cost of Capital.
- Editable Inputs: Customize essential parameters such as growth rates, EBITDA %, and CAPEX assumptions.
- Quarterly and Annual Statements: A thorough analysis of Feilong Auto Components’ financial data.
- Interactive Dashboard: Dynamically visualize valuation results and projections.
Disclaimer
All information, articles, and product details provided on this website are for general informational and educational purposes only. We do not claim any ownership over, nor do we intend to infringe upon, any trademarks, copyrights, logos, brand names, or other intellectual property mentioned or depicted on this site. Such intellectual property remains the property of its respective owners, and any references here are made solely for identification or informational purposes, without implying any affiliation, endorsement, or partnership.
We make no representations or warranties, express or implied, regarding the accuracy, completeness, or suitability of any content or products presented. Nothing on this website should be construed as legal, tax, investment, financial, medical, or other professional advice. In addition, no part of this site—including articles or product references—constitutes a solicitation, recommendation, endorsement, advertisement, or offer to buy or sell any securities, franchises, or other financial instruments, particularly in jurisdictions where such activity would be unlawful.
All content is of a general nature and may not address the specific circumstances of any individual or entity. It is not a substitute for professional advice or services. Any actions you take based on the information provided here are strictly at your own risk. You accept full responsibility for any decisions or outcomes arising from your use of this website and agree to release us from any liability in connection with your use of, or reliance upon, the content or products found herein.