
|
Guangdong Vanward New Electric Co., Ltd. (002543.sz) Valoración de DCF |
Completamente Editable: Adáptelo A Sus Necesidades En Excel O Sheets
Diseño Profesional: Plantillas Confiables Y Estándares De La Industria
Predeterminadas Para Un Uso Rápido Y Eficiente
Compatible con MAC / PC, completamente desbloqueado
No Se Necesita Experiencia; Fáciles De Seguir
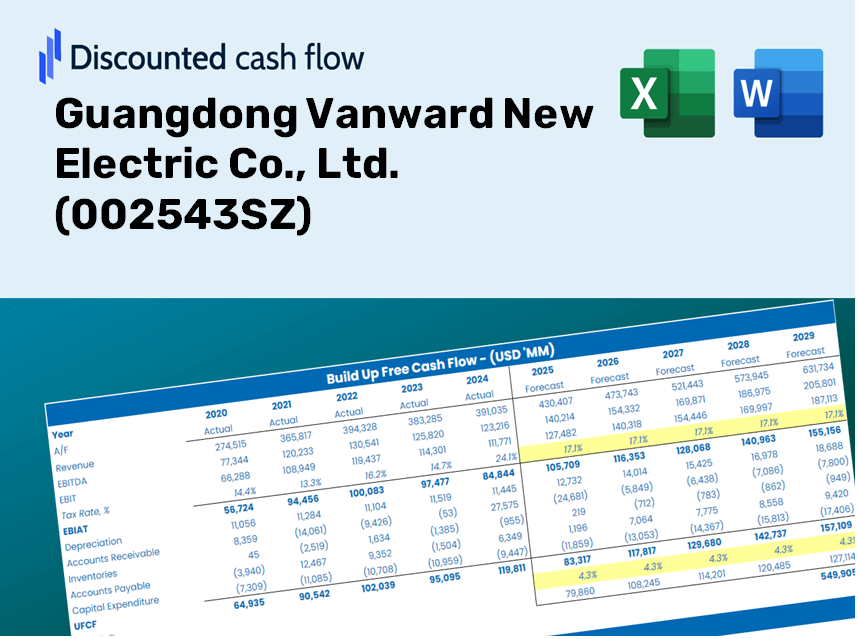
Guangdong Vanward New Electric Co., Ltd. (002543.SZ) Bundle
Diseñada para la precisión, nuestra calculadora DCF (002543SZ) le permite evaluar la valoración de Guangdong Vanward New Electric Co., Ltd. utilizando datos financieros del mundo real y flexibilidad completa para modificar todos los parámetros clave para las proyecciones mejoradas.
Discounted Cash Flow (DCF) - (USD MM)
| Year | AY1 2020 |
AY2 2021 |
AY3 2022 |
AY4 2023 |
AY5 2024 |
FY1 2025 |
FY2 2026 |
FY3 2027 |
FY4 2028 |
FY5 2029 |
|---|---|---|---|---|---|---|---|---|---|---|
| Revenue | 6,269.7 | 7,527.1 | 6,627.8 | 6,103.8 | 7,342.0 | 7,718.0 | 8,113.3 | 8,528.8 | 8,965.7 | 9,424.8 |
| Revenue Growth, % | 0 | 20.05 | -11.95 | -7.91 | 20.29 | 5.12 | 5.12 | 5.12 | 5.12 | 5.12 |
| EBITDA | 661.9 | 620.5 | 751.9 | 819.9 | 866.9 | 854.9 | 898.7 | 944.7 | 993.1 | 1,044.0 |
| EBITDA, % | 10.56 | 8.24 | 11.34 | 13.43 | 11.81 | 11.08 | 11.08 | 11.08 | 11.08 | 11.08 |
| Depreciation | 164.4 | 150.5 | 148.5 | 138.7 | 130.1 | 168.3 | 177.0 | 186.0 | 195.6 | 205.6 |
| Depreciation, % | 2.62 | 2 | 2.24 | 2.27 | 1.77 | 2.18 | 2.18 | 2.18 | 2.18 | 2.18 |
| EBIT | 497.5 | 470.0 | 603.3 | 681.2 | 736.8 | 686.6 | 721.7 | 758.7 | 797.6 | 838.4 |
| EBIT, % | 7.94 | 6.24 | 9.1 | 11.16 | 10.04 | 8.9 | 8.9 | 8.9 | 8.9 | 8.9 |
| Total Cash | 1,159.9 | 1,827.7 | 1,623.8 | 3,187.9 | 2,386.2 | 2,346.4 | 2,466.6 | 2,592.9 | 2,725.8 | 2,865.4 |
| Total Cash, percent | .0 | .0 | .0 | .0 | .0 | .0 | .0 | .0 | .0 | .0 |
| Account Receivables | 1,476.2 | 1,106.2 | 1,000.3 | 1,177.1 | 1,636.7 | 1,465.0 | 1,540.1 | 1,619.0 | 1,701.9 | 1,789.0 |
| Account Receivables, % | 23.55 | 14.7 | 15.09 | 19.28 | 22.29 | 18.98 | 18.98 | 18.98 | 18.98 | 18.98 |
| Inventories | 1,297.9 | 1,515.5 | 919.5 | 820.8 | 1,055.2 | 1,273.9 | 1,339.2 | 1,407.8 | 1,479.9 | 1,555.7 |
| Inventories, % | 20.7 | 20.13 | 13.87 | 13.45 | 14.37 | 16.51 | 16.51 | 16.51 | 16.51 | 16.51 |
| Accounts Payable | 1,955.3 | 2,038.1 | 1,276.7 | 2,108.5 | 2,541.9 | 2,264.3 | 2,380.3 | 2,502.2 | 2,630.3 | 2,765.1 |
| Accounts Payable, % | 31.19 | 27.08 | 19.26 | 34.54 | 34.62 | 29.34 | 29.34 | 29.34 | 29.34 | 29.34 |
| Capital Expenditure | -76.6 | -96.6 | -119.4 | -314.7 | -444.1 | -239.4 | -251.7 | -264.6 | -278.1 | -292.4 |
| Capital Expenditure, % | -1.22 | -1.28 | -1.8 | -5.16 | -6.05 | -3.1 | -3.1 | -3.1 | -3.1 | -3.1 |
| Tax Rate, % | 14.21 | 14.21 | 14.21 | 14.21 | 14.21 | 14.21 | 14.21 | 14.21 | 14.21 | 14.21 |
| EBITAT | 426.7 | 405.3 | 524.9 | 591.6 | 632.1 | 592.7 | 623.1 | 655.0 | 688.5 | 723.8 |
| Depreciation | ||||||||||
| Changes in Account Receivables | ||||||||||
| Changes in Inventories | ||||||||||
| Changes in Accounts Payable | ||||||||||
| Capital Expenditure | ||||||||||
| UFCF | -304.4 | 694.4 | 494.7 | 1,169.3 | 57.5 | 197.0 | 524.1 | 550.9 | 579.1 | 608.8 |
| WACC, % | 5.73 | 5.73 | 5.73 | 5.73 | 5.73 | 5.73 | 5.73 | 5.73 | 5.73 | 5.73 |
| PV UFCF | ||||||||||
| SUM PV UFCF | 2,045.4 | |||||||||
| Long Term Growth Rate, % | 1.00 | |||||||||
| Free cash flow (T + 1) | 615 | |||||||||
| Terminal Value | 13,000 | |||||||||
| Present Terminal Value | 9,839 | |||||||||
| Enterprise Value | 11,884 | |||||||||
| Net Debt | -1,974 | |||||||||
| Equity Value | 13,858 | |||||||||
| Diluted Shares Outstanding, MM | 747 | |||||||||
| Equity Value Per Share | 18.54 |
Benefits You Will Receive
- Genuine 002543SZ Financial Data: Includes comprehensive historical and projected figures for Guangdong Vanward New Electric Co., Ltd. for accurate assessment.
- Completely Customizable Template: Easily adjust essential inputs such as revenue growth, WACC, and EBITDA percentages.
- Instant Calculations: Watch the intrinsic value of Guangdong Vanward update in real-time based on your modifications.
- Professional Valuation Tool: Crafted for investors, analysts, and consultants looking for reliable DCF results.
- User-Friendly Interface: Intuitive layout and straightforward instructions suited for all levels of expertise.
Key Features
- Customizable Forecast Inputs: Adjust essential factors such as revenue growth, EBITDA percentage, and capital expenditures.
- Instant DCF Valuation: Automatically computes intrinsic value, NPV, and additional metrics without delay.
- High-Precision Accuracy: Leverages Guangdong Vanward New Electric Co., Ltd.'s (002543SZ) actual financial data for credible valuation results.
- Effortless Scenario Analysis: Easily evaluate various assumptions and analyze different outcomes.
- Efficiency Booster: Avoid the hassle of constructing intricate valuation models from the ground up.
How It Works
- Step 1: Download the Excel file.
- Step 2: Examine the pre-filled financial data and forecasts for Guangdong Vanward New Electric Co., Ltd. (002543SZ).
- Step 3: Adjust key inputs such as revenue growth, WACC, and tax rates (highlighted cells).
- Step 4: Observe the DCF model update in real-time as you modify your assumptions.
- Step 5: Evaluate the outputs and leverage the results for your investment strategies.
Why Choose This Calculator for Guangdong Vanward New Electric Co., Ltd. (002543SZ)?
- Precise Data: Utilizing authentic financials from Vanward ensures trustworthy valuation results.
- Fully Customizable: Modify essential parameters such as growth rates, WACC, and tax rates to fit your forecasts.
- Efficiency Booster: Pre-set calculations save you the hassle of building from the ground up.
- Professional-Grade Resource: Crafted for investors, analysts, and consultants alike.
- Easy to Use: Featuring an intuitive design and detailed guidance to assist users at all levels.
Who Can Benefit from Our Solutions?
- Investors: Make informed investment choices with our comprehensive valuation tools.
- Financial Analysts: Expedite your analysis using our customizable DCF model.
- Consultants: Easily tailor our templates for client-facing presentations or reports.
- Finance Enthusiasts: Enhance your knowledge of valuation methods with practical, real-world applications.
- Educators and Students: Leverage our resources as a hands-on tool in finance courses.
Contents of the Template
- Pre-Filled Data: Features historical financial metrics and projections for Guangdong Vanward New Electric Co., Ltd. (002543SZ).
- Discounted Cash Flow Model: An editable DCF valuation model complete with automated calculations.
- Weighted Average Cost of Capital (WACC): A specialized sheet for WACC computation based on user-defined inputs.
- Key Financial Ratios: Evaluate Guangdong Vanward’s profitability, efficiency, and financial leverage.
- Customizable Inputs: Easily modify revenue growth rates, profit margins, and tax rates.
- Comprehensive Dashboard: Visual summaries through charts and tables highlighting essential valuation outcomes.
Disclaimer
All information, articles, and product details provided on this website are for general informational and educational purposes only. We do not claim any ownership over, nor do we intend to infringe upon, any trademarks, copyrights, logos, brand names, or other intellectual property mentioned or depicted on this site. Such intellectual property remains the property of its respective owners, and any references here are made solely for identification or informational purposes, without implying any affiliation, endorsement, or partnership.
We make no representations or warranties, express or implied, regarding the accuracy, completeness, or suitability of any content or products presented. Nothing on this website should be construed as legal, tax, investment, financial, medical, or other professional advice. In addition, no part of this site—including articles or product references—constitutes a solicitation, recommendation, endorsement, advertisement, or offer to buy or sell any securities, franchises, or other financial instruments, particularly in jurisdictions where such activity would be unlawful.
All content is of a general nature and may not address the specific circumstances of any individual or entity. It is not a substitute for professional advice or services. Any actions you take based on the information provided here are strictly at your own risk. You accept full responsibility for any decisions or outcomes arising from your use of this website and agree to release us from any liability in connection with your use of, or reliance upon, the content or products found herein.