
|
Suzhou Chunxing Precision Mechanical Co., Ltd. (002547.sz) Valoración de DCF |
Completamente Editable: Adáptelo A Sus Necesidades En Excel O Sheets
Diseño Profesional: Plantillas Confiables Y Estándares De La Industria
Predeterminadas Para Un Uso Rápido Y Eficiente
Compatible con MAC / PC, completamente desbloqueado
No Se Necesita Experiencia; Fáciles De Seguir
Suzhou Chunxing Precision Mechanical Co., Ltd. (002547.SZ) Bundle
¡Explore el futuro financiero de Suzhou Chunxing Precision Mechanical Co., Ltd. (002547SZ) con nuestra calculadora DCF fácil de usar! Ingrese sus proyecciones para el crecimiento, los márgenes y los gastos para determinar el valor intrínseco de Suzhou Chunxing Precision Mechanical Co., Ltd. (002547SZ) e informar sus decisiones de inversión.
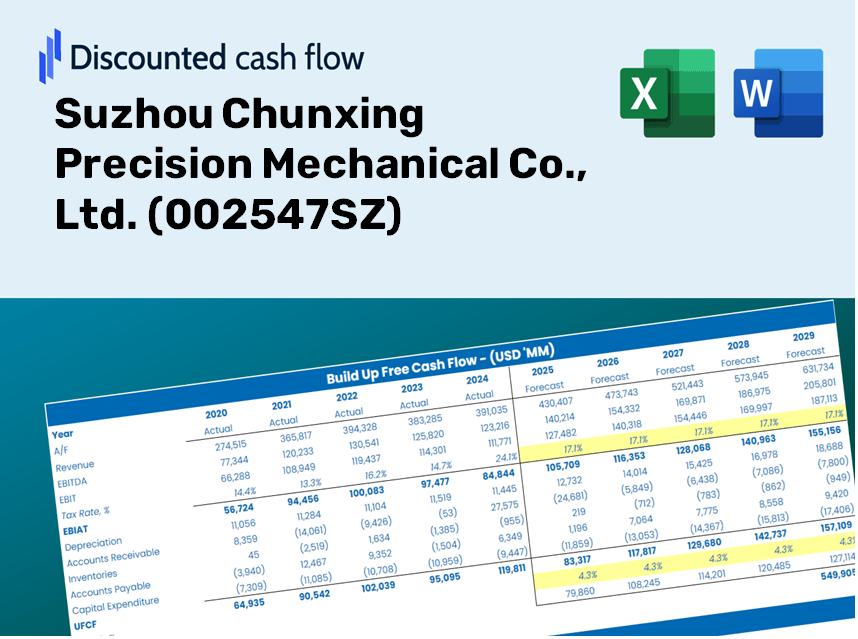
Discounted Cash Flow (DCF) - (USD MM)
| Year | AY1 2020 |
AY2 2021 |
AY3 2022 |
AY4 2023 |
AY5 2024 |
FY1 2025 |
FY2 2026 |
FY3 2027 |
FY4 2028 |
FY5 2029 |
|---|---|---|---|---|---|---|---|---|---|---|
| Revenue | 5,153.3 | 2,673.3 | 2,587.6 | 2,328.1 | 2,207.0 | 1,839.7 | 1,533.6 | 1,278.4 | 1,065.6 | 888.3 |
| Revenue Growth, % | 0 | -48.12 | -3.21 | -10.03 | -5.2 | -16.64 | -16.64 | -16.64 | -16.64 | -16.64 |
| EBITDA | -612.6 | -664.1 | 106.5 | 7.9 | 62.7 | -108.3 | -90.3 | -75.3 | -62.7 | -52.3 |
| EBITDA, % | -11.89 | -24.84 | 4.12 | 0.33876 | 2.84 | -5.89 | -5.89 | -5.89 | -5.89 | -5.89 |
| Depreciation | 280.6 | 256.9 | 217.4 | 198.1 | 200.1 | 151.0 | 125.9 | 104.9 | 87.5 | 72.9 |
| Depreciation, % | 5.45 | 9.61 | 8.4 | 8.51 | 9.07 | 8.21 | 8.21 | 8.21 | 8.21 | 8.21 |
| EBIT | -893.2 | -921.0 | -110.9 | -190.2 | -137.4 | -259.3 | -216.1 | -180.2 | -150.2 | -125.2 |
| EBIT, % | -17.33 | -34.45 | -4.29 | -8.17 | -6.23 | -14.09 | -14.09 | -14.09 | -14.09 | -14.09 |
| Total Cash | 895.2 | 976.9 | 894.2 | 614.8 | 381.1 | 486.2 | 405.3 | 337.9 | 281.7 | 234.8 |
| Total Cash, percent | .0 | .0 | .0 | .0 | .0 | .0 | .0 | .0 | .0 | .0 |
| Account Receivables | 1,114.0 | 1,388.2 | 1,193.7 | 713.9 | 760.4 | 680.0 | 566.8 | 472.5 | 393.9 | 328.3 |
| Account Receivables, % | 21.62 | 51.93 | 46.13 | 30.67 | 34.46 | 36.96 | 36.96 | 36.96 | 36.96 | 36.96 |
| Inventories | 460.9 | 434.5 | 485.3 | 389.7 | 448.9 | 298.1 | 248.5 | 207.2 | 172.7 | 144.0 |
| Inventories, % | 8.94 | 16.25 | 18.76 | 16.74 | 20.34 | 16.21 | 16.21 | 16.21 | 16.21 | 16.21 |
| Accounts Payable | 2,235.1 | 2,533.0 | 1,955.6 | 1,530.8 | 1,433.5 | 1,267.2 | 1,056.3 | 880.6 | 734.0 | 611.9 |
| Accounts Payable, % | 43.37 | 94.75 | 75.58 | 65.75 | 64.96 | 68.88 | 68.88 | 68.88 | 68.88 | 68.88 |
| Capital Expenditure | -127.2 | -242.1 | -223.9 | -379.8 | -246.0 | -175.3 | -146.1 | -121.8 | -101.5 | -84.6 |
| Capital Expenditure, % | -2.47 | -9.06 | -8.65 | -16.31 | -11.15 | -9.53 | -9.53 | -9.53 | -9.53 | -9.53 |
| Tax Rate, % | 15.11 | 15.11 | 15.11 | 15.11 | 15.11 | 15.11 | 15.11 | 15.11 | 15.11 | 15.11 |
| EBITAT | -904.4 | -881.8 | -83.9 | -159.3 | -116.6 | -228.2 | -190.2 | -158.5 | -132.2 | -110.2 |
| Depreciation | ||||||||||
| Changes in Account Receivables | ||||||||||
| Changes in Inventories | ||||||||||
| Changes in Accounts Payable | ||||||||||
| Capital Expenditure | ||||||||||
| UFCF | -90.8 | -816.9 | -524.2 | -190.3 | -365.5 | -187.6 | -258.6 | -215.5 | -179.7 | -149.8 |
| WACC, % | 4.55 | 4.5 | 4.26 | 4.35 | 4.37 | 4.4 | 4.4 | 4.4 | 4.4 | 4.4 |
| PV UFCF | ||||||||||
| SUM PV UFCF | -878.3 | |||||||||
| Long Term Growth Rate, % | 4.00 | |||||||||
| Free cash flow (T + 1) | -156 | |||||||||
| Terminal Value | -38,572 | |||||||||
| Present Terminal Value | -31,095 | |||||||||
| Enterprise Value | -31,973 | |||||||||
| Net Debt | 1,577 | |||||||||
| Equity Value | -33,550 | |||||||||
| Diluted Shares Outstanding, MM | 1,128 | |||||||||
| Equity Value Per Share | -29.74 |
What You Will Receive
- Pre-Populated Financial Model: Leverage Suzhou Chunxing's actual data for an accurate DCF valuation.
- Comprehensive Forecast Control: Modify revenue growth, profit margins, WACC, and other critical parameters.
- Real-Time Calculations: Automatic updates provide immediate feedback as you adjust inputs.
- Professional-Grade Template: A polished Excel file crafted for high-quality valuation purposes.
- Flexible and Reusable: Designed for adaptability, enabling multiple uses for thorough forecasting.
Key Features
- Comprehensive Data: Suzhou Chunxing Precision Mechanical Co., Ltd.'s historical financial statements and pre-filled projections.
- Customizable Inputs: Adjust WACC, tax rates, revenue growth, and EBITDA margins to fit your analysis.
- Real-Time Insights: Instantly view the intrinsic value of Suzhou Chunxing Precision Mechanical Co., Ltd. as it updates live.
- Engaging Visualizations: Dashboard graphs showcase valuation metrics and key performance indicators.
- Designed for Precision: A professional-grade tool for financial analysts, investors, and industry experts.
How It Works
- Step 1: Download the Excel file.
- Step 2: Examine the pre-filled data for Suzhou Chunxing Precision Mechanical Co., Ltd. (002547SZ) (historical and projected).
- Step 3: Modify the key assumptions (yellow cells) according to your analysis.
- Step 4: Observe the automatic updates reflecting Suzhou Chunxing's intrinsic value.
- Step 5: Utilize the results for investment strategies or reporting purposes.
Why Opt for This Calculator?
- All-in-One Solution: Combines DCF, WACC, and financial ratio analyses tailored for Suzhou Chunxing Precision Mechanical Co., Ltd. (002547SZ).
- Flexible Inputs: Modify the yellow-highlighted fields to explore different scenarios.
- In-depth Analysis: Automatically computes the intrinsic value and Net Present Value for Suzhou Chunxing Precision Mechanical Co., Ltd. (002547SZ).
- Data-Rich: Comes with historical and projected data to provide reliable baseline figures.
- Industry Standard: Perfect for financial analysts, investors, and business consultants seeking insights into Suzhou Chunxing Precision Mechanical Co., Ltd. (002547SZ).
Who Should Utilize This Product?
- Professional Investors: Develop comprehensive and accurate valuation models for portfolio evaluation of Suzhou Chunxing Precision Mechanical Co., Ltd. (002547SZ).
- Corporate Finance Teams: Assess valuation scenarios to inform organizational strategy for Suzhou Chunxing Precision Mechanical Co., Ltd. (002547SZ).
- Consultants and Advisors: Deliver precise valuation insights to clients considering Suzhou Chunxing Precision Mechanical Co., Ltd. (002547SZ).
- Students and Educators: Leverage real-world data to enhance financial modeling skills using Suzhou Chunxing Precision Mechanical Co., Ltd. (002547SZ).
- Industry Enthusiasts: Gain insight into how companies like Suzhou Chunxing Precision Mechanical Co., Ltd. (002547SZ) are valued within the market.
Contents of the Template
- Pre-Filled Data: Contains historical financials and projections for Suzhou Chunxing Precision Mechanical Co., Ltd. (002547SZ).
- Discounted Cash Flow Model: An editable DCF valuation model with automated calculations included.
- Weighted Average Cost of Capital (WACC): A specific sheet to calculate WACC using user-defined inputs.
- Key Financial Ratios: Assess Suzhou Chunxing's profitability, operational efficiency, and leverage.
- Customizable Inputs: Easily modify revenue growth, profit margins, and tax rates.
- Comprehensive Dashboard: Visual representations and tables that summarize essential valuation outcomes.
Disclaimer
All information, articles, and product details provided on this website are for general informational and educational purposes only. We do not claim any ownership over, nor do we intend to infringe upon, any trademarks, copyrights, logos, brand names, or other intellectual property mentioned or depicted on this site. Such intellectual property remains the property of its respective owners, and any references here are made solely for identification or informational purposes, without implying any affiliation, endorsement, or partnership.
We make no representations or warranties, express or implied, regarding the accuracy, completeness, or suitability of any content or products presented. Nothing on this website should be construed as legal, tax, investment, financial, medical, or other professional advice. In addition, no part of this site—including articles or product references—constitutes a solicitation, recommendation, endorsement, advertisement, or offer to buy or sell any securities, franchises, or other financial instruments, particularly in jurisdictions where such activity would be unlawful.
All content is of a general nature and may not address the specific circumstances of any individual or entity. It is not a substitute for professional advice or services. Any actions you take based on the information provided here are strictly at your own risk. You accept full responsibility for any decisions or outcomes arising from your use of this website and agree to release us from any liability in connection with your use of, or reliance upon, the content or products found herein.