
|
Changzhou Qianhong Biopharma Co., Ltd (002550.sz) Valoración de DCF |
Completamente Editable: Adáptelo A Sus Necesidades En Excel O Sheets
Diseño Profesional: Plantillas Confiables Y Estándares De La Industria
Predeterminadas Para Un Uso Rápido Y Eficiente
Compatible con MAC / PC, completamente desbloqueado
No Se Necesita Experiencia; Fáciles De Seguir
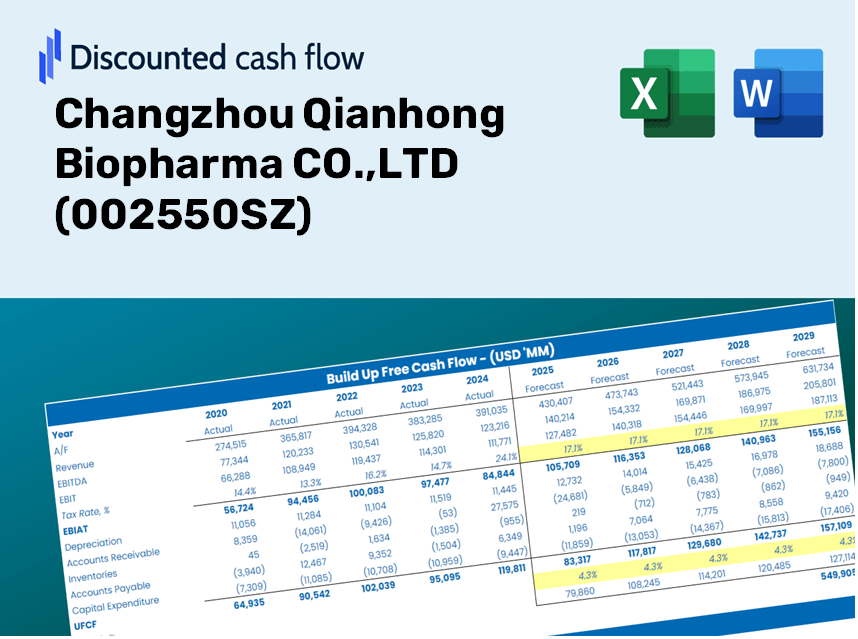
Changzhou Qianhong Biopharma CO.,LTD (002550.SZ) Bundle
¡Explore las perspectivas financieras de Changzhou Qianhong Biopharma Co., Ltd (002550SZ) con nuestra calculadora DCF fácil de usar! Ingrese sus proyecciones para el crecimiento, los márgenes y los gastos para calcular el valor intrínseco de Changzhou Qianhong Biopharma Co., Ltd (002550SZ) y refinar su enfoque de inversión.
Discounted Cash Flow (DCF) - (USD MM)
| Year | AY1 2020 |
AY2 2021 |
AY3 2022 |
AY4 2023 |
AY5 2024 |
FY1 2025 |
FY2 2026 |
FY3 2027 |
FY4 2028 |
FY5 2029 |
|---|---|---|---|---|---|---|---|---|---|---|
| Revenue | 1,667.6 | 1,874.9 | 2,303.5 | 1,814.3 | 1,526.2 | 1,519.3 | 1,512.4 | 1,505.5 | 1,498.6 | 1,491.8 |
| Revenue Growth, % | 0 | 12.43 | 22.86 | -21.24 | -15.88 | -0.45575 | -0.45575 | -0.45575 | -0.45575 | -0.45575 |
| EBITDA | 280.3 | 221.8 | 287.3 | 231.4 | 346.7 | 232.7 | 231.6 | 230.6 | 229.5 | 228.5 |
| EBITDA, % | 16.81 | 11.83 | 12.47 | 12.75 | 22.72 | 15.32 | 15.32 | 15.32 | 15.32 | 15.32 |
| Depreciation | 70.3 | 69.4 | 64.8 | 69.2 | 64.6 | 57.1 | 56.8 | 56.5 | 56.3 | 56.0 |
| Depreciation, % | 4.21 | 3.7 | 2.81 | 3.82 | 4.23 | 3.76 | 3.76 | 3.76 | 3.76 | 3.76 |
| EBIT | 210.0 | 152.4 | 222.6 | 162.2 | 282.1 | 175.7 | 174.9 | 174.1 | 173.3 | 172.5 |
| EBIT, % | 12.59 | 8.13 | 9.66 | 8.94 | 18.48 | 11.56 | 11.56 | 11.56 | 11.56 | 11.56 |
| Total Cash | 750.4 | 686.0 | 476.7 | 713.2 | 713.8 | 572.3 | 569.7 | 567.1 | 564.6 | 562.0 |
| Total Cash, percent | .0 | .0 | .0 | .0 | .0 | .0 | .0 | .0 | .0 | .0 |
| Account Receivables | 467.5 | 447.7 | 635.4 | 275.5 | 297.5 | 346.9 | 345.3 | 343.8 | 342.2 | 340.6 |
| Account Receivables, % | 28.03 | 23.88 | 27.58 | 15.19 | 19.49 | 22.83 | 22.83 | 22.83 | 22.83 | 22.83 |
| Inventories | 316.0 | 400.6 | 536.5 | 602.0 | 426.8 | 379.1 | 377.3 | 375.6 | 373.9 | 372.2 |
| Inventories, % | 18.95 | 21.37 | 23.29 | 33.18 | 27.96 | 24.95 | 24.95 | 24.95 | 24.95 | 24.95 |
| Accounts Payable | 106.2 | 71.2 | 46.0 | 41.2 | 88.6 | 61.5 | 61.2 | 61.0 | 60.7 | 60.4 |
| Accounts Payable, % | 6.37 | 3.8 | 2 | 2.27 | 5.81 | 4.05 | 4.05 | 4.05 | 4.05 | 4.05 |
| Capital Expenditure | -62.5 | -90.4 | -71.0 | -100.3 | -90.6 | -70.3 | -69.9 | -69.6 | -69.3 | -69.0 |
| Capital Expenditure, % | -3.75 | -4.82 | -3.08 | -5.53 | -5.94 | -4.62 | -4.62 | -4.62 | -4.62 | -4.62 |
| Tax Rate, % | 10.06 | 10.06 | 10.06 | 10.06 | 10.06 | 10.06 | 10.06 | 10.06 | 10.06 | 10.06 |
| EBITAT | 163.9 | 131.8 | 199.8 | 144.9 | 253.8 | 152.3 | 151.6 | 150.9 | 150.3 | 149.6 |
| Depreciation | ||||||||||
| Changes in Account Receivables | ||||||||||
| Changes in Inventories | ||||||||||
| Changes in Accounts Payable | ||||||||||
| Capital Expenditure | ||||||||||
| UFCF | -505.5 | 11.0 | -155.3 | 403.3 | 428.4 | 110.3 | 141.5 | 140.9 | 140.2 | 139.6 |
| WACC, % | 4.54 | 4.54 | 4.54 | 4.54 | 4.54 | 4.54 | 4.54 | 4.54 | 4.54 | 4.54 |
| PV UFCF | ||||||||||
| SUM PV UFCF | 587.6 | |||||||||
| Long Term Growth Rate, % | 3.00 | |||||||||
| Free cash flow (T + 1) | 144 | |||||||||
| Terminal Value | 9,352 | |||||||||
| Present Terminal Value | 7,491 | |||||||||
| Enterprise Value | 8,079 | |||||||||
| Net Debt | -420 | |||||||||
| Equity Value | 8,499 | |||||||||
| Diluted Shares Outstanding, MM | 1,272 | |||||||||
| Equity Value Per Share | 6.68 |
What You Will Receive
- Customizable Forecast Inputs: Effortlessly adjust key assumptions (growth %, margins, WACC) to explore various scenarios.
- Up-to-Date Financial Data: Pre-filled financial metrics of Changzhou Qianhong Biopharma CO.,LTD (002550SZ) to kickstart your analysis.
- Automated DCF Calculations: The template automatically computes Net Present Value (NPV) and intrinsic value for your convenience.
- Professional and Adaptable: A sleek Excel model tailored to meet your valuation requirements.
- Designed for Analysts and Investors: Perfect for testing forecasts, validating strategies, and optimizing efficiency.
Key Features
- Comprehensive DCF Calculator: Provides detailed unlevered and levered DCF valuation models tailored for Changzhou Qianhong Biopharma CO.,LTD (002550SZ).
- WACC Estimator: Includes a pre-designed Weighted Average Cost of Capital sheet with variables that can be adjusted as needed.
- Customizable Forecast Parameters: Easily update growth rates, capital expenditures, and discount rates specific to the biopharma sector.
- Integrated Financial Ratios: Evaluate profitability, leverage, and efficiency ratios for Changzhou Qianhong Biopharma CO.,LTD (002550SZ).
- Visual Dashboard and Charts: Graphics that present key valuation metrics for streamlined analysis.
How It Works
- Download: Get the pre-configured Excel file containing financial data for Changzhou Qianhong Biopharma CO.,LTD (002550SZ).
- Customize: Modify forecasts such as revenue growth, EBITDA %, and WACC according to your analysis.
- Update Automatically: Enjoy real-time updates for intrinsic value and NPV calculations.
- Test Scenarios: Develop various projections and immediately compare the results.
- Make Decisions: Leverage the valuation insights to inform your investment choices.
Why Opt for This Calculator?
- Designed for Experts: A sophisticated tool utilized by analysts, CFOs, and consultants.
- Accurate Data: Preloaded financials for Changzhou Qianhong Biopharma CO.,LTD (002550SZ) for reliable insights.
- Flexible Scenario Testing: Effortlessly model various forecasts and assumptions.
- Clear Results: Instantly computes intrinsic value, NPV, and essential metrics.
- User-Friendly: Step-by-step guidance ensures a smooth experience.
Who Should Utilize This Product?
- Investors: Accurately assess the fair value of Changzhou Qianhong Biopharma CO.,LTD (002550SZ) before making investment choices.
- CFOs: Utilize a professional-grade DCF model for financial reporting and strategic analysis.
- Consultants: Easily customize the template for client valuation reports.
- Entrepreneurs: Acquire insights into financial modeling practices employed by leading biopharma companies.
- Educators: Implement it as a resource for teaching valuation techniques.
Contents of the Template
- Pre-Filled Data: Features Changzhou Qianhong Biopharma CO.,LTD's historical financials and projections.
- Discounted Cash Flow Model: An editable DCF valuation model with automatic computations.
- Weighted Average Cost of Capital (WACC): A separate sheet for computing WACC based on personalized inputs.
- Key Financial Ratios: Evaluate the company's profitability, efficiency, and leverage metrics.
- Customizable Inputs: Effortlessly adjust revenue growth rates, profit margins, and tax rates.
- Intuitive Dashboard: Visual representations and tables displaying essential valuation outcomes.
Disclaimer
All information, articles, and product details provided on this website are for general informational and educational purposes only. We do not claim any ownership over, nor do we intend to infringe upon, any trademarks, copyrights, logos, brand names, or other intellectual property mentioned or depicted on this site. Such intellectual property remains the property of its respective owners, and any references here are made solely for identification or informational purposes, without implying any affiliation, endorsement, or partnership.
We make no representations or warranties, express or implied, regarding the accuracy, completeness, or suitability of any content or products presented. Nothing on this website should be construed as legal, tax, investment, financial, medical, or other professional advice. In addition, no part of this site—including articles or product references—constitutes a solicitation, recommendation, endorsement, advertisement, or offer to buy or sell any securities, franchises, or other financial instruments, particularly in jurisdictions where such activity would be unlawful.
All content is of a general nature and may not address the specific circumstances of any individual or entity. It is not a substitute for professional advice or services. Any actions you take based on the information provided here are strictly at your own risk. You accept full responsibility for any decisions or outcomes arising from your use of this website and agree to release us from any liability in connection with your use of, or reliance upon, the content or products found herein.