
|
Shijiazhuang Yiling Pharmaceutical Co., Ltd. (002603.sz) DCF Valoración |
Completamente Editable: Adáptelo A Sus Necesidades En Excel O Sheets
Diseño Profesional: Plantillas Confiables Y Estándares De La Industria
Predeterminadas Para Un Uso Rápido Y Eficiente
Compatible con MAC / PC, completamente desbloqueado
No Se Necesita Experiencia; Fáciles De Seguir
Shijiazhuang Yiling Pharmaceutical Co., Ltd. (002603.SZ) Bundle
¡Descubra el verdadero valor de Shijiazhuang Yiling Pharmaceutical Co., Ltd. (002603SZ) con nuestra calculadora DCF de nivel superior! Ajuste los supuestos clave, explore varios escenarios y evalúe cómo los cambios afectan la valoración de Shijiazhuang Yiling Pharmaceutical Co., Ltd. (002603Sz), todo dentro de una conveniente plantilla de Excel.
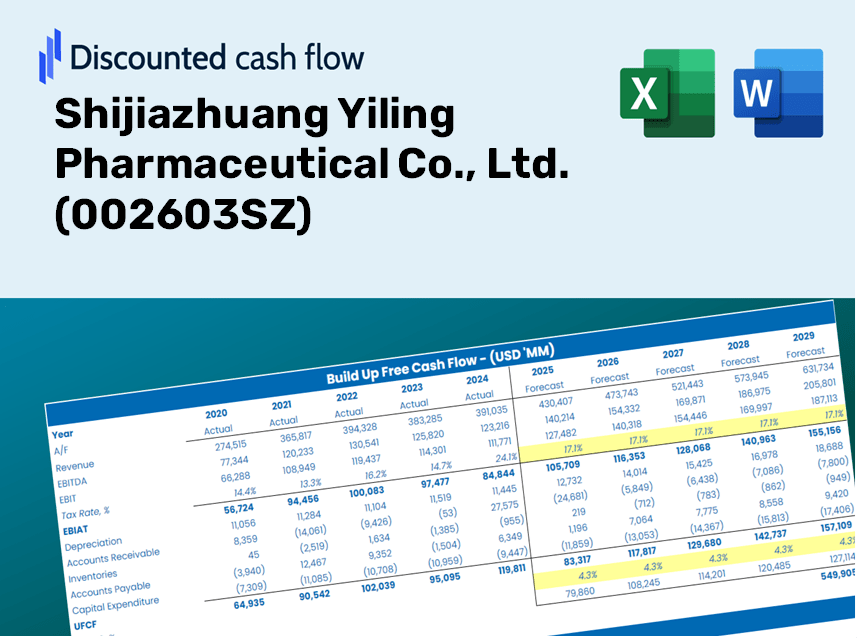
Discounted Cash Flow (DCF) - (USD MM)
| Year | AY1 2020 |
AY2 2021 |
AY3 2022 |
AY4 2023 |
AY5 2024 |
FY1 2025 |
FY2 2026 |
FY3 2027 |
FY4 2028 |
FY5 2029 |
|---|---|---|---|---|---|---|---|---|---|---|
| Revenue | 8,782.5 | 10,116.8 | 12,532.8 | 10,318.3 | 6,512.7 | 6,260.7 | 6,018.5 | 5,785.6 | 5,561.8 | 5,346.6 |
| Revenue Growth, % | 0 | 15.19 | 23.88 | -17.67 | -36.88 | -3.87 | -3.87 | -3.87 | -3.87 | -3.87 |
| EBITDA | 1,694.5 | 1,871.4 | 3,294.0 | 2,153.5 | -236.5 | 1,018.2 | 978.8 | 940.9 | 904.5 | 869.5 |
| EBITDA, % | 19.29 | 18.5 | 26.28 | 20.87 | -3.63 | 16.26 | 16.26 | 16.26 | 16.26 | 16.26 |
| Depreciation | 268.2 | 352.6 | 440.6 | 540.6 | 600.5 | 307.0 | 295.1 | 283.7 | 272.7 | 262.1 |
| Depreciation, % | 3.05 | 3.49 | 3.52 | 5.24 | 9.22 | 4.9 | 4.9 | 4.9 | 4.9 | 4.9 |
| EBIT | 1,426.3 | 1,518.7 | 2,853.4 | 1,612.8 | -837.0 | 711.2 | 683.7 | 657.2 | 631.8 | 607.4 |
| EBIT, % | 16.24 | 15.01 | 22.77 | 15.63 | -12.85 | 11.36 | 11.36 | 11.36 | 11.36 | 11.36 |
| Total Cash | 1,554.0 | 1,050.5 | 2,422.7 | 1,146.5 | 853.0 | 896.8 | 862.1 | 828.7 | 796.6 | 765.8 |
| Total Cash, percent | .0 | .0 | .0 | .0 | .0 | .0 | .0 | .0 | .0 | .0 |
| Account Receivables | 1,756.3 | 2,610.1 | 2,177.7 | 2,601.8 | 1,520.0 | 1,399.0 | 1,344.9 | 1,292.8 | 1,242.8 | 1,194.7 |
| Account Receivables, % | 20 | 25.8 | 17.38 | 25.22 | 23.34 | 22.35 | 22.35 | 22.35 | 22.35 | 22.35 |
| Inventories | 1,580.3 | 1,672.7 | 2,021.8 | 2,458.7 | 1,746.4 | 1,268.5 | 1,219.4 | 1,172.2 | 1,126.9 | 1,083.3 |
| Inventories, % | 17.99 | 16.53 | 16.13 | 23.83 | 26.81 | 20.26 | 20.26 | 20.26 | 20.26 | 20.26 |
| Accounts Payable | 1,188.4 | 1,621.2 | 2,060.8 | 2,846.5 | 1,461.9 | 1,202.5 | 1,156.0 | 1,111.2 | 1,068.2 | 1,026.9 |
| Accounts Payable, % | 13.53 | 16.02 | 16.44 | 27.59 | 22.45 | 19.21 | 19.21 | 19.21 | 19.21 | 19.21 |
| Capital Expenditure | -1,144.8 | -673.6 | -214.0 | -310.8 | -290.4 | -361.5 | -347.5 | -334.1 | -321.1 | -308.7 |
| Capital Expenditure, % | -13.03 | -6.66 | -1.71 | -3.01 | -4.46 | -5.77 | -5.77 | -5.77 | -5.77 | -5.77 |
| Tax Rate, % | 9.46 | 9.46 | 9.46 | 9.46 | 9.46 | 9.46 | 9.46 | 9.46 | 9.46 | 9.46 |
| EBITAT | 1,222.1 | 1,313.6 | 2,424.6 | 1,295.1 | -757.9 | 608.8 | 585.2 | 562.6 | 540.8 | 519.9 |
| Depreciation | ||||||||||
| Changes in Account Receivables | ||||||||||
| Changes in Inventories | ||||||||||
| Changes in Accounts Payable | ||||||||||
| Capital Expenditure | ||||||||||
| UFCF | -1,802.8 | 479.2 | 3,174.2 | 1,449.7 | -38.2 | 893.7 | 589.5 | 566.7 | 544.7 | 523.7 |
| WACC, % | 6.34 | 6.34 | 6.34 | 6.33 | 6.35 | 6.34 | 6.34 | 6.34 | 6.34 | 6.34 |
| PV UFCF | ||||||||||
| SUM PV UFCF | 2,643.9 | |||||||||
| Long Term Growth Rate, % | 3.50 | |||||||||
| Free cash flow (T + 1) | 542 | |||||||||
| Terminal Value | 19,079 | |||||||||
| Present Terminal Value | 14,030 | |||||||||
| Enterprise Value | 16,674 | |||||||||
| Net Debt | -835 | |||||||||
| Equity Value | 17,509 | |||||||||
| Diluted Shares Outstanding, MM | 1,671 | |||||||||
| Equity Value Per Share | 10.48 |
What You Will Receive
- Authentic Yiling Pharmaceutical Data: Access to historical and projected financial information for precise valuation.
- Customizable Inputs: Adjust WACC, tax rates, revenue growth, and capital investments as needed.
- Dynamic Calculations: Intrinsic value and NPV are updated in real-time.
- Scenario Testing: Evaluate various scenarios to assess the future performance of Shijiazhuang Yiling Pharmaceutical Co., Ltd. (002603SZ).
- User-Friendly Design: Designed for industry professionals while remaining approachable for newcomers.
Key Features
- Comprehensive Data: Shijiazhuang Yiling Pharmaceutical Co., Ltd.’s historical financial reports and predefined projections.
- Customizable Variables: Modify WACC, tax rates, revenue growth, and EBITDA margins as needed.
- Real-Time Calculation: Watch the intrinsic value of Shijiazhuang Yiling Pharmaceutical Co., Ltd. recalculate instantly.
- Visual Data Presentation: Dashboard graphs illustrate valuation outcomes and essential metrics.
- Designed for Precision: A professional-grade tool tailored for analysts, investors, and financial specialists.
How It Works
- Step 1: Download the Excel file.
- Step 2: Review the pre-populated data for Shijiazhuang Yiling Pharmaceutical Co., Ltd. (002603SZ) (historical and projected).
- Step 3: Modify the key assumptions (highlighted in yellow) according to your analysis.
- Step 4: Observe the automatic recalculations for the intrinsic value of Shijiazhuang Yiling Pharmaceutical Co., Ltd. (002603SZ).
- Step 5: Utilize the results for investment decisions or reporting purposes.
Why Choose Shijiazhuang Yiling Pharmaceutical Co., Ltd. (002603SZ)?
- Save Time: Our platform eliminates the need to build financial models from scratch – it's ready to use right away.
- Enhance Accuracy: Access to reliable financial data and established formulas minimizes valuation errors.
- Completely Customizable: Adapt the model to fit your specific assumptions and forecasts.
- Intuitive Analysis: Easily digestible charts and outputs simplify result interpretation.
- Trusted by Professionals: Developed for experts who prioritize precision and ease of use.
Who Can Benefit from This Product?
- Professional Investors: Develop comprehensive and trustworthy valuation models for analyzing portfolios related to Shijiazhuang Yiling Pharmaceutical Co., Ltd. (002603SZ).
- Corporate Finance Teams: Assess various valuation scenarios to inform strategic decisions within the company.
- Consultants and Advisors: Equip clients with precise valuation insights for Shijiazhuang Yiling Pharmaceutical Co., Ltd. (002603SZ).
- Students and Educators: Utilize current market data to enhance learning and practice in financial modeling.
- Pharmaceutical Enthusiasts: Gain insights into how pharmaceutical companies like Shijiazhuang Yiling are valued in the marketplace.
Contents of the Template
- Pre-Filled Data: Contains historical financial information and forecasts for Shijiazhuang Yiling Pharmaceutical Co., Ltd. (002603SZ).
- Discounted Cash Flow Model: An editable DCF valuation model featuring automated calculations.
- Weighted Average Cost of Capital (WACC): A specific sheet designed to calculate WACC using personalized inputs.
- Key Financial Ratios: Evaluate the profitability, efficiency, and leverage of Shijiazhuang Yiling Pharmaceutical Co., Ltd. (002603SZ).
- Customizable Inputs: Easily modify revenue growth, profit margins, and tax rates.
- Clear Dashboard: Visual summary of key valuation results through charts and tables.
Disclaimer
All information, articles, and product details provided on this website are for general informational and educational purposes only. We do not claim any ownership over, nor do we intend to infringe upon, any trademarks, copyrights, logos, brand names, or other intellectual property mentioned or depicted on this site. Such intellectual property remains the property of its respective owners, and any references here are made solely for identification or informational purposes, without implying any affiliation, endorsement, or partnership.
We make no representations or warranties, express or implied, regarding the accuracy, completeness, or suitability of any content or products presented. Nothing on this website should be construed as legal, tax, investment, financial, medical, or other professional advice. In addition, no part of this site—including articles or product references—constitutes a solicitation, recommendation, endorsement, advertisement, or offer to buy or sell any securities, franchises, or other financial instruments, particularly in jurisdictions where such activity would be unlawful.
All content is of a general nature and may not address the specific circumstances of any individual or entity. It is not a substitute for professional advice or services. Any actions you take based on the information provided here are strictly at your own risk. You accept full responsibility for any decisions or outcomes arising from your use of this website and agree to release us from any liability in connection with your use of, or reliance upon, the content or products found herein.