
|
Guangdong Dongfang Precision Science & Technology Co., Ltd. (002611.sz) Valoración de DCF |
Completamente Editable: Adáptelo A Sus Necesidades En Excel O Sheets
Diseño Profesional: Plantillas Confiables Y Estándares De La Industria
Predeterminadas Para Un Uso Rápido Y Eficiente
Compatible con MAC / PC, completamente desbloqueado
No Se Necesita Experiencia; Fáciles De Seguir
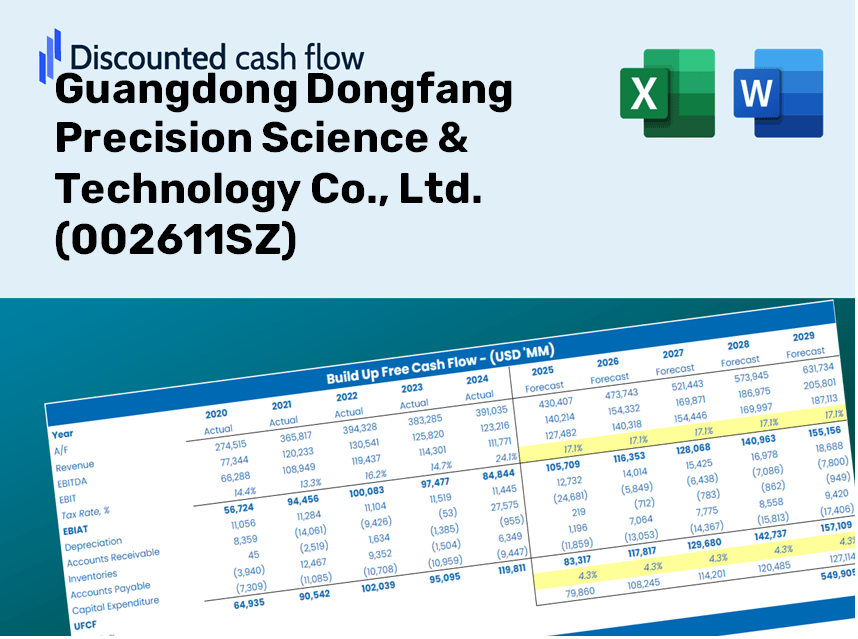
Guangdong Dongfang Precision Science & Technology Co., Ltd. (002611.SZ) Bundle
¡Mejore sus opciones de inversión con la calculadora DCF (002611SZ)! Utilice datos financieros precisos de Guangdong Dongfang Precision Science & Technology Co., Ltd., ajusta las predicciones y gastos de crecimiento, y observa instantáneamente cómo estas variaciones afectan el valor intrínseco de la empresa.
Discounted Cash Flow (DCF) - (USD MM)
| Year | AY1 2020 |
AY2 2021 |
AY3 2022 |
AY4 2023 |
AY5 2024 |
FY1 2025 |
FY2 2026 |
FY3 2027 |
FY4 2028 |
FY5 2029 |
|---|---|---|---|---|---|---|---|---|---|---|
| Revenue | 2,916.3 | 3,524.7 | 3,892.7 | 4,745.7 | 4,777.9 | 5,421.6 | 6,152.1 | 6,981.0 | 7,921.6 | 8,988.9 |
| Revenue Growth, % | 0 | 20.86 | 10.44 | 21.91 | 0.67678 | 13.47 | 13.47 | 13.47 | 13.47 | 13.47 |
| EBITDA | 348.2 | 455.1 | 508.0 | 667.1 | 818.8 | 749.2 | 850.2 | 964.7 | 1,094.7 | 1,242.2 |
| EBITDA, % | 11.94 | 12.91 | 13.05 | 14.06 | 17.14 | 13.82 | 13.82 | 13.82 | 13.82 | 13.82 |
| Depreciation | 67.0 | 73.2 | 69.7 | 73.8 | 73.2 | 100.3 | 113.8 | 129.2 | 146.6 | 166.3 |
| Depreciation, % | 2.3 | 2.08 | 1.79 | 1.56 | 1.53 | 1.85 | 1.85 | 1.85 | 1.85 | 1.85 |
| EBIT | 281.2 | 381.9 | 438.3 | 593.3 | 745.6 | 648.9 | 736.3 | 835.5 | 948.1 | 1,075.9 |
| EBIT, % | 9.64 | 10.84 | 11.26 | 12.5 | 15.6 | 11.97 | 11.97 | 11.97 | 11.97 | 11.97 |
| Total Cash | 2,522.0 | 2,452.5 | 2,135.3 | 2,477.7 | 2,517.7 | 3,424.5 | 3,885.9 | 4,409.5 | 5,003.6 | 5,677.7 |
| Total Cash, percent | .0 | .0 | .0 | .0 | .0 | .0 | .0 | .0 | .0 | .0 |
| Account Receivables | 568.6 | 880.9 | 942.3 | 1,007.0 | 953.0 | 1,191.2 | 1,351.7 | 1,533.9 | 1,740.5 | 1,975.1 |
| Account Receivables, % | 19.5 | 24.99 | 24.21 | 21.22 | 19.95 | 21.97 | 21.97 | 21.97 | 21.97 | 21.97 |
| Inventories | 734.1 | 867.3 | 1,093.0 | 1,182.4 | 1,031.9 | 1,348.6 | 1,530.3 | 1,736.4 | 1,970.4 | 2,235.9 |
| Inventories, % | 25.17 | 24.61 | 28.08 | 24.92 | 21.6 | 24.87 | 24.87 | 24.87 | 24.87 | 24.87 |
| Accounts Payable | 397.2 | 768.5 | 898.2 | 890.0 | 831.4 | 1,026.3 | 1,164.6 | 1,321.5 | 1,499.5 | 1,701.6 |
| Accounts Payable, % | 13.62 | 21.8 | 23.07 | 18.75 | 17.4 | 18.93 | 18.93 | 18.93 | 18.93 | 18.93 |
| Capital Expenditure | -150.7 | -66.3 | -217.7 | -307.7 | -358.2 | -288.7 | -327.6 | -371.7 | -421.8 | -478.6 |
| Capital Expenditure, % | -5.17 | -1.88 | -5.59 | -6.48 | -7.5 | -5.32 | -5.32 | -5.32 | -5.32 | -5.32 |
| Tax Rate, % | 31.8 | 31.8 | 31.8 | 31.8 | 31.8 | 31.8 | 31.8 | 31.8 | 31.8 | 31.8 |
| EBITAT | 260.4 | 371.5 | 387.4 | 390.2 | 508.5 | 535.0 | 607.1 | 688.9 | 781.7 | 887.1 |
| Depreciation | ||||||||||
| Changes in Account Receivables | ||||||||||
| Changes in Inventories | ||||||||||
| Changes in Accounts Payable | ||||||||||
| Capital Expenditure | ||||||||||
| UFCF | -728.8 | 304.3 | 82.0 | -6.1 | 369.4 | -13.3 | 189.5 | 215.0 | 244.0 | 276.8 |
| WACC, % | 4.92 | 4.93 | 4.92 | 4.88 | 4.89 | 4.91 | 4.91 | 4.91 | 4.91 | 4.91 |
| PV UFCF | ||||||||||
| SUM PV UFCF | 765.0 | |||||||||
| Long Term Growth Rate, % | 3.50 | |||||||||
| Free cash flow (T + 1) | 287 | |||||||||
| Terminal Value | 20,354 | |||||||||
| Present Terminal Value | 16,018 | |||||||||
| Enterprise Value | 16,783 | |||||||||
| Net Debt | -1,471 | |||||||||
| Equity Value | 18,254 | |||||||||
| Diluted Shares Outstanding, MM | 1,198 | |||||||||
| Equity Value Per Share | 15.24 |
Benefits You Will Receive
- Accurate 002611SZ Financial Data: Access to both historical and projected data for precise valuation.
- Customizable Inputs: Adjust parameters such as WACC, tax rates, revenue growth, and capital expenditures.
- Real-Time Calculations: Intrinsic value and NPV are updated automatically.
- Scenario Simulation: Explore various scenarios to assess Guangdong Dongfang's future performance.
- User-Friendly Interface: Designed for professionals while remaining easy to navigate for newcomers.
Key Features
- 🔍 Real-Life DPST Financials: Comprehensive historical and projected data for Guangdong Dongfang Precision Science & Technology Co., Ltd. (002611SZ).
- ✏️ Fully Customizable Inputs: Tailor essential parameters (yellow cells) such as WACC, growth %, and tax rates to your preferences.
- 📊 Professional DCF Valuation: Integrated formulas assess the intrinsic value of Guangdong Dongfang Precision using the Discounted Cash Flow method.
- ⚡ Instant Results: Quickly visualize the valuation of DPST after making any adjustments.
- Scenario Analysis: Evaluate and compare different financial assumptions side-by-side for informed decision-making.
How It Operates
- Download: Obtain the pre-built Excel file containing Guangdong Dongfang Precision Science & Technology Co., Ltd.'s [002611SZ] financial data.
- Customize: Modify projections, including revenue growth rates, EBITDA percentages, and WACC.
- Update in Real-Time: The calculations for intrinsic value and NPV refresh automatically.
- Simulate Scenarios: Generate various forecasts and instantly compare the results.
- Make Informed Decisions: Utilize the valuation outcomes to shape your investment approach.
Why Choose This Calculator for Guangdong Dongfang Precision Science & Technology Co., Ltd. (002611SZ)?
- User-Friendly Interface: Tailored for both newcomers and seasoned users.
- Customizable Inputs: Effortlessly adjust parameters to suit your analysis needs.
- Real-Time Valuation: Observe immediate updates to the company's valuation as you modify inputs.
- Preloaded Financials: Comes equipped with Guangdong Dongfang’s actual financial data for swift evaluations.
- Relied Upon by Experts: Utilized by investors and analysts for making well-informed decisions.
Who Can Benefit from This Product?
- Investors: Gain a precise understanding of Guangdong Dongfang Precision Science & Technology Co., Ltd.’s (002611SZ) intrinsic value before making investment choices.
- CFOs: Utilize a high-quality DCF model for comprehensive financial reporting and analysis for Guangdong Dongfang Precision Science & Technology Co., Ltd. (002611SZ).
- Consultants: Efficiently customize the template for client valuation reports involving Guangdong Dongfang Precision Science & Technology Co., Ltd. (002611SZ).
- Entrepreneurs: Acquire knowledge about financial modeling practices employed by industry leaders like Guangdong Dongfang Precision Science & Technology Co., Ltd. (002611SZ).
- Educators: Implement this resource as a teaching aid to illustrate various valuation techniques related to Guangdong Dongfang Precision Science & Technology Co., Ltd. (002611SZ).
Contents of the Template
- Operating and Balance Sheet Data: Pre-filled historical data and forecasts for Guangdong Dongfang Precision Science & Technology Co., Ltd. (002611SZ), covering revenue, EBITDA, EBIT, and capital expenditures.
- WACC Calculation: A specialized sheet for calculating the Weighted Average Cost of Capital (WACC), incorporating variables such as Beta, risk-free rate, and share price.
- DCF Valuation (Unlevered and Levered): Customizable Discounted Cash Flow models that illustrate intrinsic value along with comprehensive calculations.
- Financial Statements: Pre-loaded annual and quarterly financial statements to facilitate in-depth analysis.
- Key Ratios: Features essential profitability, leverage, and efficiency ratios for Guangdong Dongfang Precision Science & Technology Co., Ltd. (002611SZ).
- Dashboard and Charts: A visual overview of valuation outputs and assumptions for simplified analysis of results.
Disclaimer
All information, articles, and product details provided on this website are for general informational and educational purposes only. We do not claim any ownership over, nor do we intend to infringe upon, any trademarks, copyrights, logos, brand names, or other intellectual property mentioned or depicted on this site. Such intellectual property remains the property of its respective owners, and any references here are made solely for identification or informational purposes, without implying any affiliation, endorsement, or partnership.
We make no representations or warranties, express or implied, regarding the accuracy, completeness, or suitability of any content or products presented. Nothing on this website should be construed as legal, tax, investment, financial, medical, or other professional advice. In addition, no part of this site—including articles or product references—constitutes a solicitation, recommendation, endorsement, advertisement, or offer to buy or sell any securities, franchises, or other financial instruments, particularly in jurisdictions where such activity would be unlawful.
All content is of a general nature and may not address the specific circumstances of any individual or entity. It is not a substitute for professional advice or services. Any actions you take based on the information provided here are strictly at your own risk. You accept full responsibility for any decisions or outcomes arising from your use of this website and agree to release us from any liability in connection with your use of, or reliance upon, the content or products found herein.