
|
Daoming Optics & Chemical Co., Ltd (002632.sz) Valoración de DCF |
Completamente Editable: Adáptelo A Sus Necesidades En Excel O Sheets
Diseño Profesional: Plantillas Confiables Y Estándares De La Industria
Predeterminadas Para Un Uso Rápido Y Eficiente
Compatible con MAC / PC, completamente desbloqueado
No Se Necesita Experiencia; Fáciles De Seguir
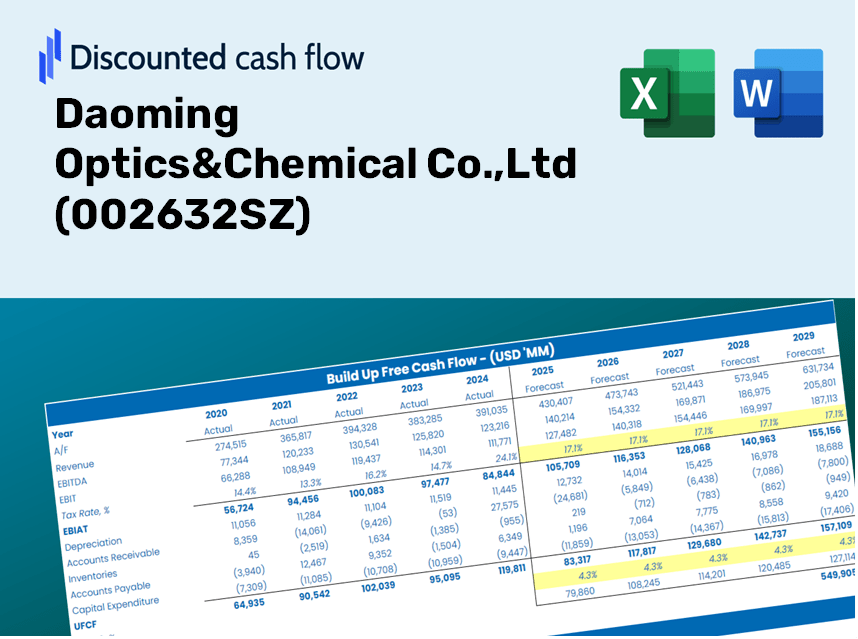
Daoming Optics&Chemical Co.,Ltd (002632.SZ) Bundle
Buscando calcular el valor intrínseco de Daoming Optics & Chemical Co., Ltd? Nuestra calculadora DCF (002632SZ) integra datos del mundo real con características integrales de personalización, lo que le permite refinar sus pronósticos y mejorar sus estrategias de inversión.
Discounted Cash Flow (DCF) - (USD MM)
| Year | AY1 2020 |
AY2 2021 |
AY3 2022 |
AY4 2023 |
AY5 2024 |
FY1 2025 |
FY2 2026 |
FY3 2027 |
FY4 2028 |
FY5 2029 |
|---|---|---|---|---|---|---|---|---|---|---|
| Revenue | 1,266.5 | 1,283.8 | 1,286.6 | 1,322.7 | 1,441.2 | 1,489.3 | 1,539.0 | 1,590.4 | 1,643.5 | 1,698.4 |
| Revenue Growth, % | 0 | 1.37 | 0.21846 | 2.81 | 8.96 | 3.34 | 3.34 | 3.34 | 3.34 | 3.34 |
| EBITDA | 296.2 | 198.4 | 538.2 | 328.7 | 329.0 | 382.3 | 395.1 | 408.2 | 421.9 | 436.0 |
| EBITDA, % | 23.39 | 15.45 | 41.83 | 24.85 | 22.83 | 25.67 | 25.67 | 25.67 | 25.67 | 25.67 |
| Depreciation | 86.3 | 110.7 | 129.1 | 128.4 | 121.9 | 130.0 | 134.3 | 138.8 | 143.4 | 148.2 |
| Depreciation, % | 6.82 | 8.62 | 10.03 | 9.7 | 8.46 | 8.73 | 8.73 | 8.73 | 8.73 | 8.73 |
| EBIT | 209.8 | 87.7 | 409.1 | 200.3 | 207.1 | 252.3 | 260.8 | 269.5 | 278.5 | 287.8 |
| EBIT, % | 16.57 | 6.83 | 31.8 | 15.15 | 14.37 | 16.94 | 16.94 | 16.94 | 16.94 | 16.94 |
| Total Cash | 313.7 | 550.9 | 513.1 | 521.2 | 820.7 | 607.4 | 627.6 | 648.6 | 670.2 | 692.6 |
| Total Cash, percent | .0 | .0 | .0 | .0 | .0 | .0 | .0 | .0 | .0 | .0 |
| Account Receivables | 467.1 | 340.3 | 363.7 | 368.8 | 394.0 | 437.5 | 452.1 | 467.2 | 482.8 | 498.9 |
| Account Receivables, % | 36.88 | 26.51 | 28.27 | 27.88 | 27.34 | 29.38 | 29.38 | 29.38 | 29.38 | 29.38 |
| Inventories | 887.9 | 1,274.6 | 467.7 | 460.1 | 426.7 | 804.7 | 831.5 | 859.3 | 888.0 | 917.6 |
| Inventories, % | 70.11 | 99.29 | 36.35 | 34.79 | 29.61 | 54.03 | 54.03 | 54.03 | 54.03 | 54.03 |
| Accounts Payable | 209.5 | 310.6 | 252.0 | 218.3 | 203.9 | 271.0 | 280.0 | 289.4 | 299.0 | 309.0 |
| Accounts Payable, % | 16.54 | 24.19 | 19.59 | 16.51 | 14.15 | 18.2 | 18.2 | 18.2 | 18.2 | 18.2 |
| Capital Expenditure | -139.2 | -164.6 | -111.3 | -53.7 | -31.0 | -115.2 | -119.0 | -123.0 | -127.1 | -131.4 |
| Capital Expenditure, % | -10.99 | -12.82 | -8.65 | -4.06 | -2.15 | -7.74 | -7.74 | -7.74 | -7.74 | -7.74 |
| Tax Rate, % | 15.66 | 15.66 | 15.66 | 15.66 | 15.66 | 15.66 | 15.66 | 15.66 | 15.66 | 15.66 |
| EBITAT | 178.6 | 59.6 | 318.6 | 162.0 | 174.7 | 199.9 | 206.6 | 213.5 | 220.6 | 228.0 |
| Depreciation | ||||||||||
| Changes in Account Receivables | ||||||||||
| Changes in Inventories | ||||||||||
| Changes in Accounts Payable | ||||||||||
| Capital Expenditure | ||||||||||
| UFCF | -1,019.8 | -153.1 | 1,061.3 | 205.5 | 259.3 | -139.7 | 189.4 | 195.8 | 202.3 | 209.1 |
| WACC, % | 6.72 | 6.68 | 6.71 | 6.71 | 6.72 | 6.71 | 6.71 | 6.71 | 6.71 | 6.71 |
| PV UFCF | ||||||||||
| SUM PV UFCF | 503.7 | |||||||||
| Long Term Growth Rate, % | 3.50 | |||||||||
| Free cash flow (T + 1) | 216 | |||||||||
| Terminal Value | 6,740 | |||||||||
| Present Terminal Value | 4,871 | |||||||||
| Enterprise Value | 5,375 | |||||||||
| Net Debt | 172 | |||||||||
| Equity Value | 5,203 | |||||||||
| Diluted Shares Outstanding, MM | 629 | |||||||||
| Equity Value Per Share | 8.27 |
Benefits You Will Receive
- Authentic Daoming Data: Preloaded financial metrics – encompassing revenue to EBIT – based on actual and forecasted information.
- Complete Customization: Modify all key parameters (yellow cells) such as WACC, growth rates, and tax percentages.
- Immediate Valuation Updates: Automatic recalculations to evaluate the effects of changes on Daoming Optics&Chemical Co.,Ltd (002632SZ) fair value.
- Flexible Excel Template: Designed for swift modifications, scenario analysis, and comprehensive projections.
- Efficient and Precise: Avoid building models from scratch while ensuring accuracy and adaptability.
Key Features
- Comprehensive DCF Calculator: Offers detailed unlevered and levered DCF valuation models tailored for Daoming Optics & Chemical Co., Ltd (002632SZ).
- WACC Calculator: Features a pre-built Weighted Average Cost of Capital sheet with adjustable input parameters.
- Customizable Forecast Assumptions: Easily modify growth rates, capital expenditures, and discount rates to fit your analysis.
- Integrated Financial Ratios: Evaluate profitability, leverage, and efficiency ratios specific to Daoming Optics & Chemical Co., Ltd (002632SZ).
- Intuitive Dashboard and Charts: Visual representations provide a summary of essential valuation metrics for straightforward analysis.
How It Works
- Step 1: Download the Excel file.
- Step 2: Review Daoming Optics & Chemical Co., Ltd's pre-filled financial data and forecasts.
- Step 3: Modify key inputs such as revenue growth, WACC, and tax rates (highlighted cells).
- Step 4: Observe the DCF model update in real-time as you adjust your assumptions.
- Step 5: Evaluate the outputs and apply the results to your investment strategy.
Why Choose Daoming Optics & Chemical Co., Ltd (002632SZ) Calculator?
- Save Time: Skip the hassle of building a DCF model from scratch – it's ready for immediate use.
- Enhance Accuracy: Dependable financial data and formulas minimize valuation errors.
- Completely Customizable: Modify the model to align with your specific assumptions and forecasts.
- User-Friendly Design: Intuitive charts and outputs facilitate easy result analysis.
- Endorsed by Professionals: Crafted for experts who prioritize precision and user experience.
Who Can Benefit from This Product?
- Investment Professionals: Develop comprehensive and accurate valuation models for portfolio assessment of Daoming Optics & Chemical Co., Ltd (002632SZ).
- Corporate Finance Departments: Evaluate valuation scenarios to support strategic decisions within the organization.
- Consultants and Financial Advisors: Deliver precise valuation analyses to clients regarding Daoming Optics & Chemical Co., Ltd (002632SZ).
- Students and Instructors: Utilize real market data for practical exercises and education in financial modeling.
- Industry Enthusiasts: Gain insights into how companies like Daoming Optics & Chemical Co., Ltd (002632SZ) are appraised in the market.
Contents of the Template
- Pre-Filled DCF Model: Daoming Optics & Chemical Co., Ltd’s financial data preloaded for immediate analysis.
- WACC Calculator: Comprehensive calculations for Weighted Average Cost of Capital.
- Financial Ratios: Assess Daoming’s profitability, leverage, and operational efficiency.
- Editable Inputs: Modify assumptions such as growth rates, profit margins, and CAPEX to tailor your scenarios.
- Financial Statements: Annual and quarterly reports for in-depth analysis.
- Interactive Dashboard: Effortlessly visualize key valuation metrics and outcomes.
Disclaimer
All information, articles, and product details provided on this website are for general informational and educational purposes only. We do not claim any ownership over, nor do we intend to infringe upon, any trademarks, copyrights, logos, brand names, or other intellectual property mentioned or depicted on this site. Such intellectual property remains the property of its respective owners, and any references here are made solely for identification or informational purposes, without implying any affiliation, endorsement, or partnership.
We make no representations or warranties, express or implied, regarding the accuracy, completeness, or suitability of any content or products presented. Nothing on this website should be construed as legal, tax, investment, financial, medical, or other professional advice. In addition, no part of this site—including articles or product references—constitutes a solicitation, recommendation, endorsement, advertisement, or offer to buy or sell any securities, franchises, or other financial instruments, particularly in jurisdictions where such activity would be unlawful.
All content is of a general nature and may not address the specific circumstances of any individual or entity. It is not a substitute for professional advice or services. Any actions you take based on the information provided here are strictly at your own risk. You accept full responsibility for any decisions or outcomes arising from your use of this website and agree to release us from any liability in connection with your use of, or reliance upon, the content or products found herein.