
|
Global Top E-Commerce Co., Ltd. (002640.sz) Valoración de DCF |
Completamente Editable: Adáptelo A Sus Necesidades En Excel O Sheets
Diseño Profesional: Plantillas Confiables Y Estándares De La Industria
Predeterminadas Para Un Uso Rápido Y Eficiente
Compatible con MAC / PC, completamente desbloqueado
No Se Necesita Experiencia; Fáciles De Seguir
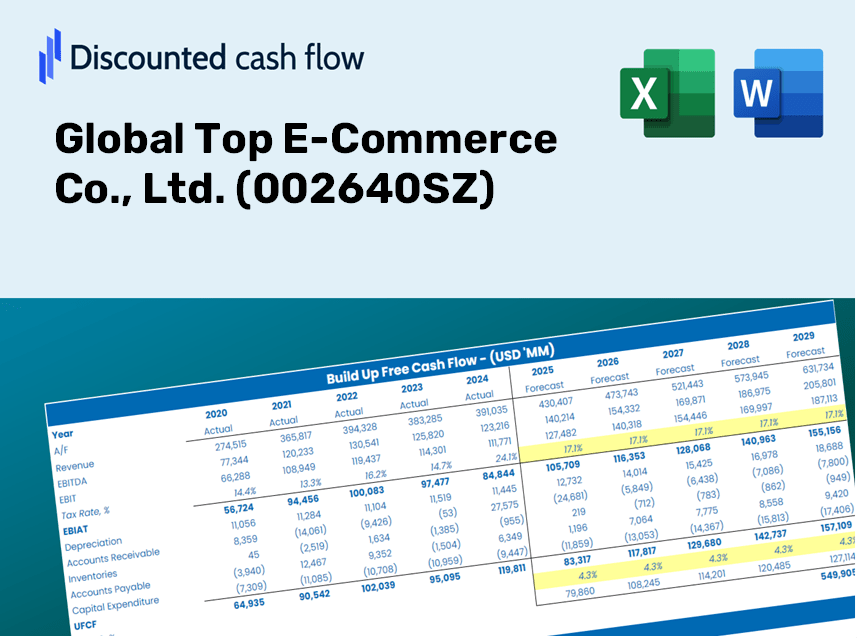
Global Top E-Commerce Co., Ltd. (002640.SZ) Bundle
¡Mejore sus estrategias de inversión con la calculadora DCF (002640SZ)! Explore los datos financieros reales para Global Top E-Commerce Co., Ltd., ajuste las proyecciones y gastos de crecimiento, y observe los efectos inmediatos sobre el valor intrínseco de (002640SZ).
Discounted Cash Flow (DCF) - (USD MM)
| Year | AY1 2020 |
AY2 2021 |
AY3 2022 |
AY4 2023 |
AY5 2024 |
FY1 2025 |
FY2 2026 |
FY3 2027 |
FY4 2028 |
FY5 2029 |
|---|---|---|---|---|---|---|---|---|---|---|
| Revenue | 16,423.7 | 8,817.7 | 7,254.5 | 6,616.4 | 5,719.2 | 4,483.9 | 3,515.4 | 2,756.1 | 2,160.8 | 1,694.1 |
| Revenue Growth, % | 0 | -46.31 | -17.73 | -8.8 | -13.56 | -21.6 | -21.6 | -21.6 | -21.6 | -21.6 |
| EBITDA | -1,517.5 | 1,013.0 | 230.5 | 224.9 | -280.4 | 35.2 | 27.6 | 21.6 | 17.0 | 13.3 |
| EBITDA, % | -9.24 | 11.49 | 3.18 | 3.4 | -4.9 | 0.78445 | 0.78445 | 0.78445 | 0.78445 | 0.78445 |
| Depreciation | 113.0 | 95.9 | 46.0 | 28.7 | 19.9 | 28.6 | 22.4 | 17.6 | 13.8 | 10.8 |
| Depreciation, % | 0.68791 | 1.09 | 0.63475 | 0.43401 | 0.34709 | 0.63826 | 0.63826 | 0.63826 | 0.63826 | 0.63826 |
| EBIT | -1,630.5 | 917.1 | 184.5 | 196.2 | -300.2 | 6.6 | 5.1 | 4.0 | 3.2 | 2.5 |
| EBIT, % | -9.93 | 10.4 | 2.54 | 2.96 | -5.25 | 0.14619 | 0.14619 | 0.14619 | 0.14619 | 0.14619 |
| Total Cash | 658.6 | 528.9 | 526.5 | 304.9 | 144.8 | 218.9 | 171.6 | 134.5 | 105.5 | 82.7 |
| Total Cash, percent | .0 | .0 | .0 | .0 | .0 | .0 | .0 | .0 | .0 | .0 |
| Account Receivables | 883.1 | 842.7 | 963.7 | 989.2 | 970.3 | 539.3 | 422.8 | 331.5 | 259.9 | 203.7 |
| Account Receivables, % | 5.38 | 9.56 | 13.28 | 14.95 | 16.97 | 12.03 | 12.03 | 12.03 | 12.03 | 12.03 |
| Inventories | 1,676.2 | 389.3 | 418.6 | 523.1 | 357.2 | 309.8 | 242.9 | 190.4 | 149.3 | 117.0 |
| Inventories, % | 10.21 | 4.42 | 5.77 | 7.91 | 6.25 | 6.91 | 6.91 | 6.91 | 6.91 | 6.91 |
| Accounts Payable | 2,070.5 | 299.6 | 238.1 | 195.1 | 186.0 | 228.6 | 179.2 | 140.5 | 110.1 | 86.4 |
| Accounts Payable, % | 12.61 | 3.4 | 3.28 | 2.95 | 3.25 | 5.1 | 5.1 | 5.1 | 5.1 | 5.1 |
| Capital Expenditure | -40.9 | -12.5 | -4.9 | -1.7 | -.9 | -4.5 | -3.5 | -2.8 | -2.2 | -1.7 |
| Capital Expenditure, % | -0.24915 | -0.14155 | -0.06709395 | -0.0258479 | -0.01597427 | -0.09992254 | -0.09992254 | -0.09992254 | -0.09992254 | -0.09992254 |
| Tax Rate, % | -8.04 | -8.04 | -8.04 | -8.04 | -8.04 | -8.04 | -8.04 | -8.04 | -8.04 | -8.04 |
| EBITAT | -1,770.3 | 831.5 | 39.4 | -61.0 | -324.3 | 4.1 | 3.2 | 2.5 | 2.0 | 1.5 |
| Depreciation | ||||||||||
| Changes in Account Receivables | ||||||||||
| Changes in Inventories | ||||||||||
| Changes in Accounts Payable | ||||||||||
| Capital Expenditure | ||||||||||
| UFCF | -2,187.0 | 471.3 | -131.3 | -206.9 | -129.6 | 549.2 | 156.1 | 122.4 | 96.0 | 75.2 |
| WACC, % | 6.23 | 6.09 | 5.03 | 4.7 | 6.23 | 5.66 | 5.66 | 5.66 | 5.66 | 5.66 |
| PV UFCF | ||||||||||
| SUM PV UFCF | 897.7 | |||||||||
| Long Term Growth Rate, % | 2.00 | |||||||||
| Free cash flow (T + 1) | 77 | |||||||||
| Terminal Value | 2,100 | |||||||||
| Present Terminal Value | 1,595 | |||||||||
| Enterprise Value | 2,492 | |||||||||
| Net Debt | -138 | |||||||||
| Equity Value | 2,630 | |||||||||
| Diluted Shares Outstanding, MM | 1,545 | |||||||||
| Equity Value Per Share | 1.70 |
What You Will Receive
- Authentic (002640SZ) Financial Data: Pre-loaded with Global Top E-Commerce's historical and forecasted figures for accurate assessments.
- Completely Customizable Template: Easily adjust key factors such as revenue growth, WACC, and EBITDA margins.
- Instantaneous Calculations: Watch the intrinsic value of (002640SZ) update in real-time as you make modifications.
- Expert Valuation Tool: Tailored for investors, analysts, and consultants aiming for precise DCF outcomes.
- User-Centric Design: Intuitive layout and straightforward guidance suitable for all skill levels.
Highlighted Features
- Comprehensive DCF Calculator: Offers in-depth unlevered and levered DCF valuation models tailored for Global Top E-Commerce Co., Ltd. (002640SZ).
- WACC Calculator: Features a pre-designed Weighted Average Cost of Capital sheet with adjustable parameters.
- Customizable Forecast Assumptions: Adjust growth projections, capital expenditures, and discount rates as needed.
- Integrated Financial Ratios: Evaluate profitability, leverage, and efficiency ratios specifically for Global Top E-Commerce Co., Ltd. (002640SZ).
- Interactive Dashboard and Charts: Visual representations summarize essential valuation metrics for straightforward analysis.
How It Operates
- Download the Template: Gain immediate access to the Excel-based GTEC DCF Calculator.
- Input Your Assumptions: Modify the yellow-highlighted cells for growth projections, WACC, margins, and other parameters.
- Instant Calculations: The model will automatically refresh to reflect Global Top E-Commerce Co., Ltd.’s intrinsic value.
- Test Scenarios: Experiment with various assumptions to assess potential changes in valuation.
- Analyze and Decide: Utilize the findings to inform your investment or financial strategies.
Why Opt for Our Calculator?
- All-in-One Solution: Integrates DCF, WACC, and financial ratio evaluations in a single tool.
- Flexible Parameters: Modify the highlighted cells to experiment with different scenarios.
- In-Depth Analysis: Automatically computes the intrinsic value and Net Present Value for Global Top E-Commerce Co., Ltd. (002640SZ).
- Preloaded Information: Historical and projected data provide reliable baselines.
- High-Quality Standards: Perfect for financial analysts, investors, and business advisors.
Who Can Benefit from This Product?
- Individual Investors: Gain insights for making informed investment choices regarding Global Top E-Commerce Co., Ltd. (002640SZ).
- Financial Analysts: Enhance efficiency in valuation tasks with readily available financial models.
- Consultants: Provide clients with accurate and timely valuation analysis.
- Business Owners: Learn how major players like Global Top E-Commerce Co., Ltd. (002640SZ) are valued to inform your strategic decisions.
- Finance Students: Master valuation methodologies through the use of real-world data and case studies.
Contents of the Template
- Historical Data: Featuring past financials and baseline forecasts for Global Top E-Commerce Co., Ltd. (002640SZ).
- DCF and Levered DCF Models: Comprehensive templates designed to compute the intrinsic value of Global Top E-Commerce Co., Ltd. (002640SZ).
- WACC Sheet: Pre-configured calculations for the Weighted Average Cost of Capital.
- Editable Inputs: Adjust essential factors such as growth rates, EBITDA percentages, and CAPEX assumptions.
- Quarterly and Annual Statements: A thorough analysis of Global Top E-Commerce Co., Ltd. (002640SZ) financials.
- Interactive Dashboard: Dynamically visualize valuation results and projections.
Disclaimer
All information, articles, and product details provided on this website are for general informational and educational purposes only. We do not claim any ownership over, nor do we intend to infringe upon, any trademarks, copyrights, logos, brand names, or other intellectual property mentioned or depicted on this site. Such intellectual property remains the property of its respective owners, and any references here are made solely for identification or informational purposes, without implying any affiliation, endorsement, or partnership.
We make no representations or warranties, express or implied, regarding the accuracy, completeness, or suitability of any content or products presented. Nothing on this website should be construed as legal, tax, investment, financial, medical, or other professional advice. In addition, no part of this site—including articles or product references—constitutes a solicitation, recommendation, endorsement, advertisement, or offer to buy or sell any securities, franchises, or other financial instruments, particularly in jurisdictions where such activity would be unlawful.
All content is of a general nature and may not address the specific circumstances of any individual or entity. It is not a substitute for professional advice or services. Any actions you take based on the information provided here are strictly at your own risk. You accept full responsibility for any decisions or outcomes arising from your use of this website and agree to release us from any liability in connection with your use of, or reliance upon, the content or products found herein.