
|
Changying Xinzhi Technology Co., Ltd. (002664.sz) Valoración de DCF |
Completamente Editable: Adáptelo A Sus Necesidades En Excel O Sheets
Diseño Profesional: Plantillas Confiables Y Estándares De La Industria
Predeterminadas Para Un Uso Rápido Y Eficiente
Compatible con MAC / PC, completamente desbloqueado
No Se Necesita Experiencia; Fáciles De Seguir
Changying Xinzhi Technology Co.,Ltd. (002664.SZ) Bundle
¿Busca determinar el valor intrínseco de cambiar Xinzhi Technology Co., Ltd.? Nuestra calculadora DCF (002664SZ) integra datos reales del mercado con extensas funciones de personalización, lo que le permite refinar sus pronósticos y mejorar sus estrategias de inversión.
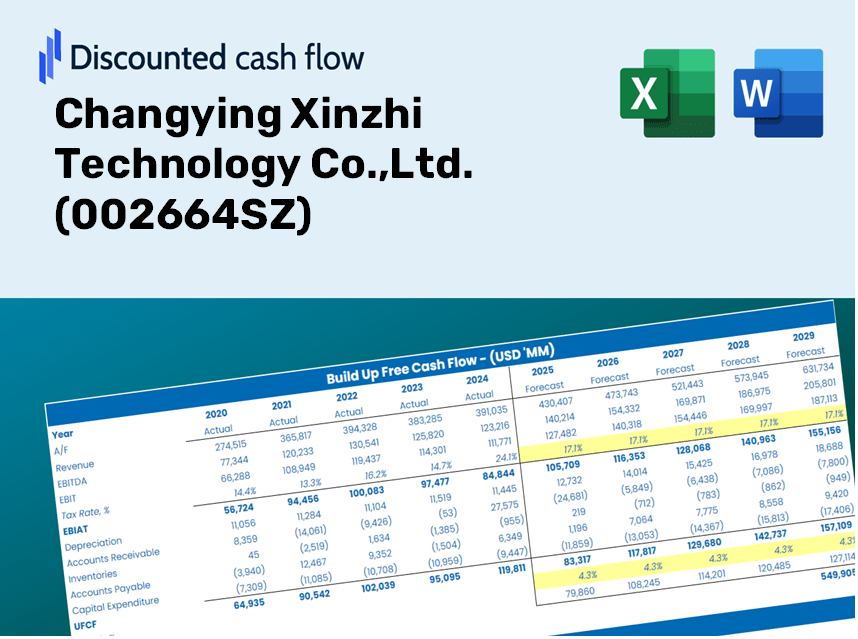
Discounted Cash Flow (DCF) - (USD MM)
| Year | AY1 2020 |
AY2 2021 |
AY3 2022 |
AY4 2023 |
AY5 2024 |
FY1 2025 |
FY2 2026 |
FY3 2027 |
FY4 2028 |
FY5 2029 |
|---|---|---|---|---|---|---|---|---|---|---|
| Revenue | 2,878.3 | 3,355.6 | 3,717.1 | 4,615.9 | 5,918.4 | 7,098.5 | 8,513.8 | 10,211.3 | 12,247.3 | 14,689.3 |
| Revenue Growth, % | 0 | 16.58 | 10.77 | 24.18 | 28.22 | 19.94 | 19.94 | 19.94 | 19.94 | 19.94 |
| EBITDA | 494.8 | 326.3 | 351.7 | 486.0 | 301.5 | 738.2 | 885.4 | 1,062.0 | 1,273.7 | 1,527.7 |
| EBITDA, % | 17.19 | 9.72 | 9.46 | 10.53 | 5.09 | 10.4 | 10.4 | 10.4 | 10.4 | 10.4 |
| Depreciation | 85.7 | 94.6 | 120.5 | 167.9 | 208.8 | 230.0 | 275.9 | 330.9 | 396.9 | 476.0 |
| Depreciation, % | 2.98 | 2.82 | 3.24 | 3.64 | 3.53 | 3.24 | 3.24 | 3.24 | 3.24 | 3.24 |
| EBIT | 409.1 | 231.7 | 231.2 | 318.1 | 92.7 | 508.2 | 609.5 | 731.1 | 876.8 | 1,051.7 |
| EBIT, % | 14.21 | 6.91 | 6.22 | 6.89 | 1.57 | 7.16 | 7.16 | 7.16 | 7.16 | 7.16 |
| Total Cash | 630.0 | 767.6 | 988.5 | 1,129.2 | 1,972.5 | 1,833.5 | 2,199.1 | 2,637.5 | 3,163.4 | 3,794.2 |
| Total Cash, percent | .0 | .0 | .0 | .0 | .0 | .0 | .0 | .0 | .0 | .0 |
| Account Receivables | 912.1 | 957.1 | 1,122.2 | 1,601.0 | 1,998.0 | 2,255.1 | 2,704.7 | 3,244.0 | 3,890.8 | 4,666.6 |
| Account Receivables, % | 31.69 | 28.52 | 30.19 | 34.68 | 33.76 | 31.77 | 31.77 | 31.77 | 31.77 | 31.77 |
| Inventories | 440.1 | 710.4 | 920.3 | 936.7 | 1,075.2 | 1,415.2 | 1,697.3 | 2,035.8 | 2,441.7 | 2,928.5 |
| Inventories, % | 15.29 | 21.17 | 24.76 | 20.29 | 18.17 | 19.94 | 19.94 | 19.94 | 19.94 | 19.94 |
| Accounts Payable | 1,440.2 | 1,491.3 | 2,247.3 | 2,734.0 | 3,445.5 | 3,867.0 | 4,638.0 | 5,562.8 | 6,671.9 | 8,002.2 |
| Accounts Payable, % | 50.04 | 44.44 | 60.46 | 59.23 | 58.22 | 54.48 | 54.48 | 54.48 | 54.48 | 54.48 |
| Capital Expenditure | -283.3 | -302.7 | -464.2 | -747.8 | -791.6 | -865.0 | -1,037.5 | -1,244.3 | -1,492.4 | -1,790.0 |
| Capital Expenditure, % | -9.84 | -9.02 | -12.49 | -16.2 | -13.37 | -12.19 | -12.19 | -12.19 | -12.19 | -12.19 |
| Tax Rate, % | 38.65 | 38.65 | 38.65 | 38.65 | 38.65 | 38.65 | 38.65 | 38.65 | 38.65 | 38.65 |
| EBITAT | 357.8 | 215.3 | 295.7 | 280.9 | 56.9 | 437.1 | 524.2 | 628.8 | 754.1 | 904.5 |
| Depreciation | ||||||||||
| Changes in Account Receivables | ||||||||||
| Changes in Inventories | ||||||||||
| Changes in Accounts Payable | ||||||||||
| Capital Expenditure | ||||||||||
| UFCF | 248.1 | -257.0 | 333.0 | -307.4 | -350.0 | -373.4 | -198.1 | -237.6 | -285.0 | -341.8 |
| WACC, % | 5.53 | 5.56 | 5.61 | 5.53 | 5.35 | 5.52 | 5.52 | 5.52 | 5.52 | 5.52 |
| PV UFCF | ||||||||||
| SUM PV UFCF | -1,225.2 | |||||||||
| Long Term Growth Rate, % | 3.00 | |||||||||
| Free cash flow (T + 1) | -352 | |||||||||
| Terminal Value | -13,982 | |||||||||
| Present Terminal Value | -10,689 | |||||||||
| Enterprise Value | -11,914 | |||||||||
| Net Debt | 1,155 | |||||||||
| Equity Value | -13,069 | |||||||||
| Diluted Shares Outstanding, MM | 422 | |||||||||
| Equity Value Per Share | -31.01 |
What You Will Receive
- Adjustable Forecast Parameters: Effortlessly modify key assumptions (growth %, margins, WACC) to generate various scenarios.
- Real-Time Data: Changying Xinzhi Technology Co., Ltd. (002664SZ) financial data pre-loaded to accelerate your analysis.
- Automated DCF Calculations: Our template computes Net Present Value (NPV) and intrinsic value on your behalf.
- Tailored and Professional: A refined Excel model designed to meet your valuation requirements.
- Designed for Analysts and Investors: Perfect for evaluating forecasts, confirming strategies, and optimizing efficiency.
Key Features
- Comprehensive DCF Calculator: Features detailed unlevered and levered DCF valuation models tailored for Changying Xinzhi Technology Co., Ltd. (002664SZ).
- WACC Calculation Tool: Pre-structured Weighted Average Cost of Capital sheet with adjustable parameters.
- Customizable Forecast Assumptions: Easily modify growth projections, capital expenditures, and discount rates.
- Integrated Financial Ratios: Evaluate profitability, leverage, and efficiency ratios specific to Changying Xinzhi Technology Co., Ltd. (002664SZ).
- Interactive Dashboard and Charts: Visual displays summarize critical valuation metrics for straightforward analysis.
How It Functions
- Step 1: Download the Excel spreadsheet.
- Step 2: Examine the pre-filled data for Changying Xinzhi Technology Co., Ltd. (002664SZ) (historical and projected).
- Step 3: Modify key assumptions (highlighted in yellow) based on your analysis.
- Step 4: Observe automatic recalculations for the intrinsic value of Changying Xinzhi Technology Co., Ltd. (002664SZ).
- Step 5: Leverage the results for your investment choices or reporting needs.
Why Choose This Calculator for Changying Xinzhi Technology Co.,Ltd. (002664SZ)?
- User-Friendly Interface: Crafted for both novices and seasoned professionals.
- Customizable Inputs: Adjust parameters effortlessly to suit your analysis needs.
- Real-Time Valuation Updates: Witness immediate adjustments to Changying Xinzhi’s valuation as you change inputs.
- Pre-Loaded Financial Data: Comes with Changying Xinzhi’s actual financial metrics for swift analysis.
- Relied Upon by Experts: A go-to tool for investors and analysts seeking to make informed choices.
Who Can Benefit from This Product?
- Investment Professionals: Create comprehensive and accurate valuation models for analyzing portfolios involving Changying Xinzhi Technology Co., Ltd. (002664SZ).
- Corporate Finance Departments: Evaluate valuation scenarios to inform strategic decisions within their organizations.
- Consultants and Financial Advisors: Offer clients precise valuation insights related to Changying Xinzhi Technology Co., Ltd. (002664SZ).
- Students and Instructors: Utilize actual market data for learning and teaching financial modeling techniques.
- Technology Enthusiasts: Gain insights into how tech firms like Changying Xinzhi Technology Co., Ltd. (002664SZ) are valued in the marketplace.
Contents of the Template
- Preloaded 002664SZ Data: Historical and projected financial information, including revenue, EBIT, and capital expenditures.
- DCF and WACC Models: Advanced spreadsheets designed for calculating intrinsic value and Weighted Average Cost of Capital.
- Editable Inputs: Cells highlighted in yellow for modifying revenue growth, tax rates, and discount rates.
- Financial Statements: Detailed annual and quarterly financial statements for thorough analysis.
- Key Ratios: Metrics on profitability, leverage, and efficiency to assess performance.
- Dashboard and Charts: Visual representations of valuation results and underlying assumptions.
Disclaimer
All information, articles, and product details provided on this website are for general informational and educational purposes only. We do not claim any ownership over, nor do we intend to infringe upon, any trademarks, copyrights, logos, brand names, or other intellectual property mentioned or depicted on this site. Such intellectual property remains the property of its respective owners, and any references here are made solely for identification or informational purposes, without implying any affiliation, endorsement, or partnership.
We make no representations or warranties, express or implied, regarding the accuracy, completeness, or suitability of any content or products presented. Nothing on this website should be construed as legal, tax, investment, financial, medical, or other professional advice. In addition, no part of this site—including articles or product references—constitutes a solicitation, recommendation, endorsement, advertisement, or offer to buy or sell any securities, franchises, or other financial instruments, particularly in jurisdictions where such activity would be unlawful.
All content is of a general nature and may not address the specific circumstances of any individual or entity. It is not a substitute for professional advice or services. Any actions you take based on the information provided here are strictly at your own risk. You accept full responsibility for any decisions or outcomes arising from your use of this website and agree to release us from any liability in connection with your use of, or reliance upon, the content or products found herein.