
|
Changzhou NRB Corporation (002708.sz) Valoración de DCF |
Completamente Editable: Adáptelo A Sus Necesidades En Excel O Sheets
Diseño Profesional: Plantillas Confiables Y Estándares De La Industria
Predeterminadas Para Un Uso Rápido Y Eficiente
Compatible con MAC / PC, completamente desbloqueado
No Se Necesita Experiencia; Fáciles De Seguir
Changzhou Nrb Corporation (002708.SZ) Bundle
¡Evalúe las perspectivas financieras de Changzhou NRB Corporation como un experto! Esta calculadora DCF (002708SZ) proporciona datos financieros precipidos y la flexibilidad para modificar el crecimiento de los ingresos, WACC, los márgenes y otros supuestos esenciales para alinearse con sus predicciones.
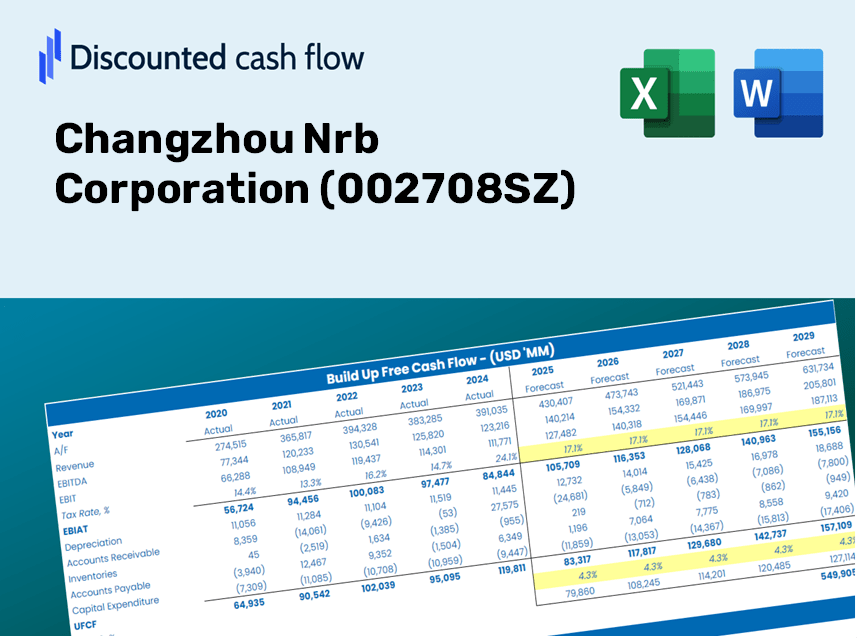
Discounted Cash Flow (DCF) - (USD MM)
| Year | AY1 2020 |
AY2 2021 |
AY3 2022 |
AY4 2023 |
AY5 2024 |
FY1 2025 |
FY2 2026 |
FY3 2027 |
FY4 2028 |
FY5 2029 |
|---|---|---|---|---|---|---|---|---|---|---|
| Revenue | 1,434.3 | 1,622.3 | 1,487.9 | 1,823.1 | 2,309.6 | 2,621.6 | 2,975.8 | 3,377.8 | 3,834.2 | 4,352.2 |
| Revenue Growth, % | 0 | 13.11 | -8.29 | 22.53 | 26.69 | 13.51 | 13.51 | 13.51 | 13.51 | 13.51 |
| EBITDA | 208.9 | 109.9 | -73.5 | 83.9 | 265.0 | 170.3 | 193.3 | 219.4 | 249.1 | 282.7 |
| EBITDA, % | 14.57 | 6.78 | -4.94 | 4.6 | 11.47 | 6.5 | 6.5 | 6.5 | 6.5 | 6.5 |
| Depreciation | 132.0 | 176.3 | 176.4 | 190.6 | 201.8 | 268.0 | 304.2 | 345.3 | 392.0 | 445.0 |
| Depreciation, % | 9.2 | 10.87 | 11.86 | 10.45 | 8.74 | 10.22 | 10.22 | 10.22 | 10.22 | 10.22 |
| EBIT | 76.9 | -66.4 | -249.9 | -106.6 | 63.2 | -97.7 | -110.9 | -125.9 | -142.9 | -162.2 |
| EBIT, % | 5.36 | -4.09 | -16.79 | -5.85 | 2.74 | -3.73 | -3.73 | -3.73 | -3.73 | -3.73 |
| Total Cash | 218.1 | 213.2 | 197.2 | 653.7 | 588.3 | 539.7 | 612.6 | 695.4 | 789.4 | 896.0 |
| Total Cash, percent | .0 | .0 | .0 | .0 | .0 | .0 | .0 | .0 | .0 | .0 |
| Account Receivables | 786.5 | 757.9 | 636.1 | 742.9 | 954.1 | 1,186.9 | 1,347.3 | 1,529.3 | 1,735.9 | 1,970.4 |
| Account Receivables, % | 54.84 | 46.72 | 42.75 | 40.75 | 41.31 | 45.27 | 45.27 | 45.27 | 45.27 | 45.27 |
| Inventories | 362.8 | 349.5 | 405.9 | 395.8 | 546.7 | 626.6 | 711.3 | 807.4 | 916.4 | 1,040.2 |
| Inventories, % | 25.29 | 21.55 | 27.28 | 21.71 | 23.67 | 23.9 | 23.9 | 23.9 | 23.9 | 23.9 |
| Accounts Payable | 664.7 | 589.6 | 691.6 | 754.3 | 714.5 | 1,056.4 | 1,199.1 | 1,361.1 | 1,545.0 | 1,753.8 |
| Accounts Payable, % | 46.35 | 36.34 | 46.48 | 41.37 | 30.94 | 40.3 | 40.3 | 40.3 | 40.3 | 40.3 |
| Capital Expenditure | -11.8 | -190.7 | -159.1 | -72.2 | -96.2 | -164.6 | -186.9 | -212.1 | -240.8 | -273.3 |
| Capital Expenditure, % | -0.82345 | -11.76 | -10.69 | -3.96 | -4.16 | -6.28 | -6.28 | -6.28 | -6.28 | -6.28 |
| Tax Rate, % | -43.3 | -43.3 | -43.3 | -43.3 | -43.3 | -43.3 | -43.3 | -43.3 | -43.3 | -43.3 |
| EBITAT | 58.8 | -66.7 | -233.1 | -89.0 | 90.6 | -88.6 | -100.5 | -114.1 | -129.5 | -147.0 |
| Depreciation | ||||||||||
| Changes in Account Receivables | ||||||||||
| Changes in Inventories | ||||||||||
| Changes in Accounts Payable | ||||||||||
| Capital Expenditure | ||||||||||
| UFCF | -305.5 | -114.3 | -48.4 | -4.6 | -205.7 | 44.1 | -85.4 | -97.0 | -110.1 | -125.0 |
| WACC, % | 6.25 | 6.34 | 6.32 | 6.28 | 6.34 | 6.31 | 6.31 | 6.31 | 6.31 | 6.31 |
| PV UFCF | ||||||||||
| SUM PV UFCF | -293.1 | |||||||||
| Long Term Growth Rate, % | 2.00 | |||||||||
| Free cash flow (T + 1) | -127 | |||||||||
| Terminal Value | -2,960 | |||||||||
| Present Terminal Value | -2,180 | |||||||||
| Enterprise Value | -2,473 | |||||||||
| Net Debt | 522 | |||||||||
| Equity Value | -2,995 | |||||||||
| Diluted Shares Outstanding, MM | 562 | |||||||||
| Equity Value Per Share | -5.33 |
What You Will Receive
- Pre-Filled Financial Model: Leverage Changzhou Nrb Corporation's actual data for accurate DCF valuation.
- Comprehensive Forecast Control: Modify revenue growth, profit margins, WACC, and other essential factors.
- Real-Time Calculations: Automatic updates provide instant feedback as adjustments are made.
- Investor-Ready Template: A polished Excel file crafted for high-quality valuation presentations.
- Customizable and Reusable: Designed for adaptability, allowing frequent use for in-depth financial forecasts.
Key Features
- Real-Time CNRC Data: Pre-loaded with Changzhou Nrb Corporation's historical financial performance and future forecasts.
- Completely Customizable Inputs: Modify revenue growth rates, profit margins, WACC, tax percentages, and capital expenditure assumptions.
- Interactive Valuation Model: Instantaneous updates to Net Present Value (NPV) and intrinsic value based on your specified parameters.
- Scenario Analysis: Develop multiple forecasting scenarios to evaluate various valuation possibilities.
- Intuitive Design: Clean, organized, and accessible for both industry professionals and newcomers.
Operation Overview
- 1. Access the Template: Download and open the Excel file featuring Changzhou Nrb Corporation’s (002708SZ) preloaded data.
- 2. Adjust Assumptions: Modify essential inputs such as growth rates, WACC, and capital expenditures.
- 3. View Results Instantly: The DCF model automatically calculates the intrinsic value and NPV.
- 4. Explore Different Scenarios: Analyze various forecasts for diverse valuation outcomes.
- 5. Present with Confidence: Provide expert valuation insights to guide your decision-making process.
Reasons to Use This Calculator for Changzhou Nrb Corporation (002708SZ)
- All-in-One Solution: Integrates DCF, WACC, and financial ratio analyses into a single tool.
- Flexible Inputs: Modify the yellow-highlighted cells to explore different scenarios.
- In-Depth Analysis: Automatically computes the intrinsic value and Net Present Value for Changzhou Nrb Corporation.
- Pre-Loaded Information: Comes with historical and projected data for accurate analyses.
- High-Quality Standards: Perfect for financial analysts, investors, and business consultants.
Who Can Benefit from This Product?
- Finance Students: Explore valuation strategies and apply them with real-world data.
- Academics: Integrate industry-standard models into your studies or research projects.
- Investors: Validate your assumptions and evaluate valuation predictions for Changzhou Nrb Corporation (002708SZ).
- Analysts: Enhance your efficiency with a ready-to-use, customizable DCF model.
- Small Business Owners: Discover how major public companies like Changzhou Nrb Corporation (002708SZ) are analyzed.
Contents of the Template
- Pre-Filled Data: Contains Changzhou Nrb Corporation’s historical financials and forecasts.
- Discounted Cash Flow Model: An editable DCF valuation model with automatic calculations.
- Weighted Average Cost of Capital (WACC): A specific sheet for calculating WACC based on user-defined inputs.
- Key Financial Ratios: Assess Changzhou Nrb Corporation's profitability, efficiency, and leverage.
- Customizable Inputs: Effortlessly adjust revenue growth, margins, and tax rates.
- Clear Dashboard: Visuals and tables summarizing essential valuation outcomes.
Disclaimer
All information, articles, and product details provided on this website are for general informational and educational purposes only. We do not claim any ownership over, nor do we intend to infringe upon, any trademarks, copyrights, logos, brand names, or other intellectual property mentioned or depicted on this site. Such intellectual property remains the property of its respective owners, and any references here are made solely for identification or informational purposes, without implying any affiliation, endorsement, or partnership.
We make no representations or warranties, express or implied, regarding the accuracy, completeness, or suitability of any content or products presented. Nothing on this website should be construed as legal, tax, investment, financial, medical, or other professional advice. In addition, no part of this site—including articles or product references—constitutes a solicitation, recommendation, endorsement, advertisement, or offer to buy or sell any securities, franchises, or other financial instruments, particularly in jurisdictions where such activity would be unlawful.
All content is of a general nature and may not address the specific circumstances of any individual or entity. It is not a substitute for professional advice or services. Any actions you take based on the information provided here are strictly at your own risk. You accept full responsibility for any decisions or outcomes arising from your use of this website and agree to release us from any liability in connection with your use of, or reliance upon, the content or products found herein.