
|
Guangzhou Tinci Material Technology Co., Ltd. (002709.SZ) DCF Valoración |
Completamente Editable: Adáptelo A Sus Necesidades En Excel O Sheets
Diseño Profesional: Plantillas Confiables Y Estándares De La Industria
Predeterminadas Para Un Uso Rápido Y Eficiente
Compatible con MAC / PC, completamente desbloqueado
No Se Necesita Experiencia; Fáciles De Seguir
Guangzhou Tinci Materials Technology Co., Ltd. (002709.SZ) Bundle
¡Explore las perspectivas financieras de Guangzhou Tinci Materials Technology Co., Ltd. (002709SZ) con nuestra calculadora DCF fácil de usar! Ingrese sus suposiciones para el crecimiento, los márgenes y los costos para calcular el valor intrínseco de Guangzhou Tinci Materials Technology Co., Ltd. (002709SZ) y refine su estrategia de inversión.
Discounted Cash Flow (DCF) - (USD MM)
| Year | AY1 2020 |
AY2 2021 |
AY3 2022 |
AY4 2023 |
AY5 2024 |
FY1 2025 |
FY2 2026 |
FY3 2027 |
FY4 2028 |
FY5 2029 |
|---|---|---|---|---|---|---|---|---|---|---|
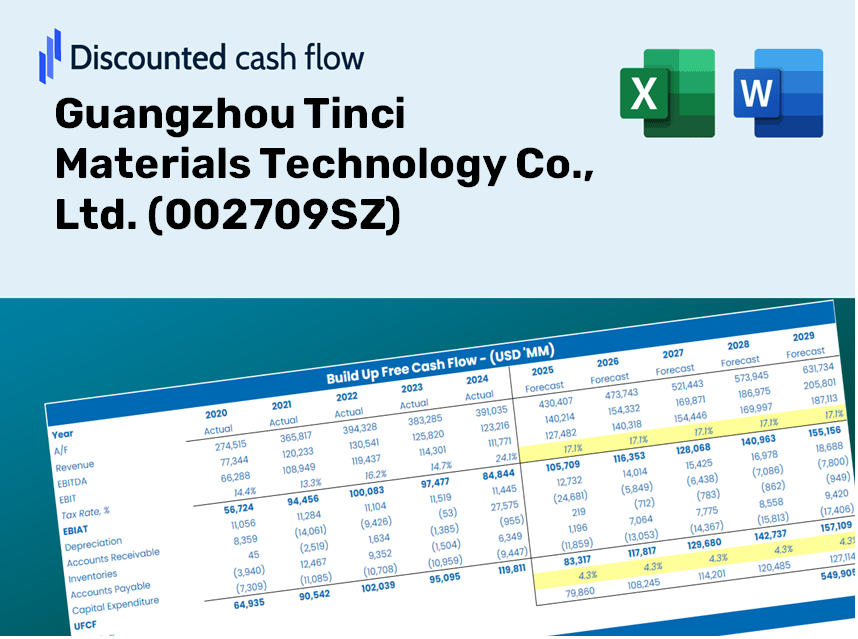
| Revenue | 4,119.0 | 11,090.8 | 22,316.9 | 15,404.6 | 12,518.3 | 17,221.7 | 23,692.4 | 32,594.2 | 44,840.6 | 61,688.3 |
| Revenue Growth, % | 0 | 169.26 | 101.22 | -30.97 | -18.74 | 37.57 | 37.57 | 37.57 | 37.57 | 37.57 |
| EBITDA | 1,129.5 | 3,356.9 | 7,195.6 | 3,099.3 | 1,710.2 | 4,261.1 | 5,862.1 | 8,064.6 | 11,094.7 | 15,263.3 |
| EBITDA, % | 27.42 | 30.27 | 32.24 | 20.12 | 13.66 | 24.74 | 24.74 | 24.74 | 24.74 | 24.74 |
| Depreciation | 284.1 | 410.4 | 497.3 | 709.9 | 943.7 | 860.2 | 1,183.4 | 1,628.0 | 2,239.6 | 3,081.1 |
| Depreciation, % | 6.9 | 3.7 | 2.23 | 4.61 | 7.54 | 4.99 | 4.99 | 4.99 | 4.99 | 4.99 |
| EBIT | 845.4 | 2,946.4 | 6,698.3 | 2,389.4 | 766.5 | 3,400.9 | 4,678.8 | 6,436.7 | 8,855.1 | 12,182.2 |
| EBIT, % | 20.53 | 26.57 | 30.01 | 15.51 | 6.12 | 19.75 | 19.75 | 19.75 | 19.75 | 19.75 |
| Total Cash | 311.6 | 2,147.8 | 4,663.8 | 2,368.4 | 1,621.1 | 2,623.0 | 3,608.5 | 4,964.3 | 6,829.5 | 9,395.4 |
| Total Cash, percent | .0 | .0 | .0 | .0 | .0 | .0 | .0 | .0 | .0 | .0 |
| Account Receivables | 1,875.8 | 5,283.4 | 7,149.8 | 5,402.6 | 5,670.1 | 7,080.9 | 9,741.4 | 13,401.5 | 18,436.7 | 25,363.9 |
| Account Receivables, % | 45.54 | 47.64 | 32.04 | 35.07 | 45.29 | 41.12 | 41.12 | 41.12 | 41.12 | 41.12 |
| Inventories | 549.6 | 1,251.6 | 2,373.8 | 1,171.9 | 1,363.7 | 1,851.9 | 2,547.7 | 3,504.9 | 4,821.8 | 6,633.5 |
| Inventories, % | 13.34 | 11.29 | 10.64 | 7.61 | 10.89 | 10.75 | 10.75 | 10.75 | 10.75 | 10.75 |
| Accounts Payable | 908.8 | 2,366.2 | 4,720.5 | 3,261.1 | 3,362.8 | 3,877.8 | 5,334.8 | 7,339.1 | 10,096.6 | 13,890.2 |
| Accounts Payable, % | 22.06 | 21.33 | 21.15 | 21.17 | 26.86 | 22.52 | 22.52 | 22.52 | 22.52 | 22.52 |
| Capital Expenditure | -357.2 | -1,610.2 | -3,681.2 | -3,102.5 | -771.5 | -2,272.8 | -3,126.8 | -4,301.6 | -5,917.8 | -8,141.3 |
| Capital Expenditure, % | -8.67 | -14.52 | -16.5 | -20.14 | -6.16 | -13.2 | -13.2 | -13.2 | -13.2 | -13.2 |
| Tax Rate, % | 25.54 | 25.54 | 25.54 | 25.54 | 25.54 | 25.54 | 25.54 | 25.54 | 25.54 | 25.54 |
| EBITAT | 719.3 | 2,408.5 | 5,570.4 | 1,943.5 | 570.7 | 2,760.1 | 3,797.2 | 5,223.8 | 7,186.6 | 9,886.7 |
| Depreciation | ||||||||||
| Changes in Account Receivables | ||||||||||
| Changes in Inventories | ||||||||||
| Changes in Accounts Payable | ||||||||||
| Capital Expenditure | ||||||||||
| UFCF | -870.3 | -1,443.4 | 1,752.1 | 1,040.7 | 385.3 | -36.6 | -45.6 | -62.7 | -86.3 | -118.7 |
| WACC, % | 8.58 | 8.57 | 8.57 | 8.57 | 8.55 | 8.57 | 8.57 | 8.57 | 8.57 | 8.57 |
| PV UFCF | ||||||||||
| SUM PV UFCF | -262.1 | |||||||||
| Long Term Growth Rate, % | 0.50 | |||||||||
| Free cash flow (T + 1) | -119 | |||||||||
| Terminal Value | -1,478 | |||||||||
| Present Terminal Value | -980 | |||||||||
| Enterprise Value | -1,242 | |||||||||
| Net Debt | 4,382 | |||||||||
| Equity Value | -5,624 | |||||||||
| Diluted Shares Outstanding, MM | 1,919 | |||||||||
| Equity Value Per Share | -2.93 |
What You Will Receive
- Pre-Loaded Financial Model: Real data from Guangzhou Tinci Materials Technology Co., Ltd. provides accurate DCF valuation.
- Comprehensive Forecast Control: Modify revenue growth rates, profit margins, WACC, and other essential metrics.
- Instantaneous Calculations: Automatic updates ensure you immediately see results as adjustments are made.
- Investor-Ready Template: A polished Excel file crafted for professional-level valuation.
- Customizable and Reusable: Designed for adaptability, enabling repeated use for in-depth forecasts.
Key Features
- Comprehensive DCF Calculator: Features detailed unlevered and levered DCF valuation models tailored for Guangzhou Tinci Materials Technology Co., Ltd. (002709SZ).
- WACC Calculator: A user-friendly Weighted Average Cost of Capital sheet with adjustable inputs for precise financial analysis.
- Customizable Forecast Assumptions: Adjust growth rates, capital expenditures, and discount rates as needed.
- Integrated Financial Ratios: Assess profitability, leverage, and efficiency ratios specific to Guangzhou Tinci Materials Technology Co., Ltd. (002709SZ).
- Visual Dashboard and Charts: Interactive visualizations present essential valuation metrics for straightforward analysis.
How It Functions
- 1. Access the Template: Download and open the Excel file featuring Guangzhou Tinci Materials Technology Co., Ltd. (002709SZ) preloaded data.
- 2. Adjust Assumptions: Modify essential inputs such as growth rates, WACC, and capital expenditures.
- 3. See Results Instantly: The DCF model automatically calculates the intrinsic value and NPV for you.
- 4. Explore Scenarios: Evaluate multiple forecasts to investigate various valuation possibilities.
- 5. Present with Assurance: Share professional valuation insights to bolster your decisions.
Why Choose Tinci’s Calculator?
- Time Efficiency: Skip the hassle of building a DCF model from the ground up – it's ready for immediate use.
- Enhanced Accuracy: Dependable financial data and formulas help minimize valuation errors.
- Completely Customizable: Modify the model to align with your specific assumptions and forecasts.
- User-Friendly: Intuitive charts and outputs ensure straightforward analysis of results.
- Endorsed by Professionals: Crafted for experts who prioritize accuracy and practicality.
Who Should Use This Product?
- Professional Investors: Develop comprehensive and reliable valuation models for analyzing portfolios related to Guangzhou Tinci Materials Technology Co., Ltd. (002709SZ).
- Corporate Finance Teams: Evaluate valuation scenarios to inform strategic decisions within their organizations.
- Consultants and Advisors: Deliver precise valuation insights on Guangzhou Tinci Materials Technology Co., Ltd. (002709SZ) to clients.
- Students and Educators: Utilize real-world data to enhance learning and practice in financial modeling.
- Materials Science Enthusiasts: Gain a deeper understanding of how companies like Guangzhou Tinci Materials Technology Co., Ltd. (002709SZ) are valued in the marketplace.
Contents of the Template
- Historical Data: Contains Guangzhou Tinci Materials Technology Co., Ltd.’s past financial information and foundational forecasts.
- DCF and Levered DCF Models: Comprehensive templates designed to determine the intrinsic value of Guangzhou Tinci Materials Technology Co., Ltd. (002709SZ).
- WACC Sheet: Pre-configured calculations for the Weighted Average Cost of Capital.
- Editable Inputs: Adjust essential factors such as growth rates, EBITDA percentage, and CAPEX assumptions.
- Quarterly and Annual Statements: A thorough analysis of the financial data for Guangzhou Tinci Materials Technology Co., Ltd. (002709SZ).
- Interactive Dashboard: Dynamically visualize valuation results and projections.
Disclaimer
All information, articles, and product details provided on this website are for general informational and educational purposes only. We do not claim any ownership over, nor do we intend to infringe upon, any trademarks, copyrights, logos, brand names, or other intellectual property mentioned or depicted on this site. Such intellectual property remains the property of its respective owners, and any references here are made solely for identification or informational purposes, without implying any affiliation, endorsement, or partnership.
We make no representations or warranties, express or implied, regarding the accuracy, completeness, or suitability of any content or products presented. Nothing on this website should be construed as legal, tax, investment, financial, medical, or other professional advice. In addition, no part of this site—including articles or product references—constitutes a solicitation, recommendation, endorsement, advertisement, or offer to buy or sell any securities, franchises, or other financial instruments, particularly in jurisdictions where such activity would be unlawful.
All content is of a general nature and may not address the specific circumstances of any individual or entity. It is not a substitute for professional advice or services. Any actions you take based on the information provided here are strictly at your own risk. You accept full responsibility for any decisions or outcomes arising from your use of this website and agree to release us from any liability in connection with your use of, or reliance upon, the content or products found herein.