
|
Sinomine Resource Group Co., Ltd. (002738.sz) Valoración de DCF |
Completamente Editable: Adáptelo A Sus Necesidades En Excel O Sheets
Diseño Profesional: Plantillas Confiables Y Estándares De La Industria
Predeterminadas Para Un Uso Rápido Y Eficiente
Compatible con MAC / PC, completamente desbloqueado
No Se Necesita Experiencia; Fáciles De Seguir
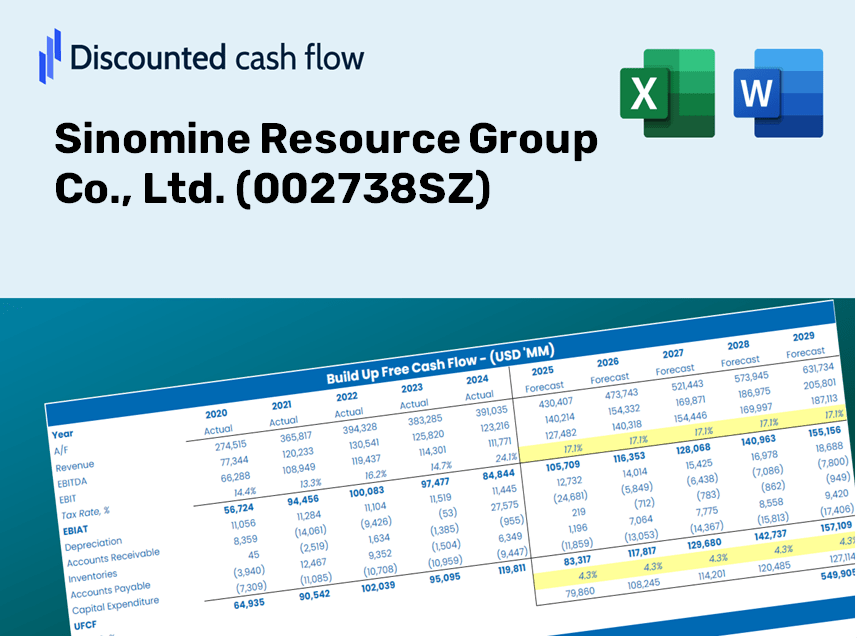
Sinomine Resource Group Co., Ltd. (002738.SZ) Bundle
¡Mejore sus opciones de inversión con la calculadora DCF de Sinomine Resource Group Co., Ltd. (002738SZ)! Utilice datos financieros auténticos de sinomina, ajuste las proyecciones y gastos de crecimiento, y observe instantáneamente cómo estos cambios afectan el valor intrínseco de Sinomine Resource Group Co., Ltd. (002738SZ).
Discounted Cash Flow (DCF) - (USD MM)
| Year | AY1 2020 |
AY2 2021 |
AY3 2022 |
AY4 2023 |
AY5 2024 |
FY1 2025 |
FY2 2026 |
FY3 2027 |
FY4 2028 |
FY5 2029 |
|---|---|---|---|---|---|---|---|---|---|---|
| Revenue | 1,275.7 | 2,394.1 | 8,041.2 | 5,875.6 | 5,363.9 | 5,040.6 | 4,736.8 | 4,451.3 | 4,183.1 | 3,931.0 |
| Revenue Growth, % | 0 | 87.67 | 235.88 | -26.93 | -8.71 | -6.03 | -6.03 | -6.03 | -6.03 | -6.03 |
| EBITDA | 327.2 | 802.9 | 4,044.8 | 2,697.1 | 1,435.8 | 1,836.3 | 1,725.6 | 1,621.6 | 1,523.9 | 1,432.1 |
| EBITDA, % | 25.64 | 33.54 | 50.3 | 45.9 | 26.77 | 36.43 | 36.43 | 36.43 | 36.43 | 36.43 |
| Depreciation | 57.3 | 67.3 | 142.9 | 175.8 | 373.5 | 191.9 | 180.3 | 169.5 | 159.2 | 149.6 |
| Depreciation, % | 4.49 | 2.81 | 1.78 | 2.99 | 6.96 | 3.81 | 3.81 | 3.81 | 3.81 | 3.81 |
| EBIT | 269.8 | 735.6 | 3,901.9 | 2,521.3 | 1,062.3 | 1,644.4 | 1,545.3 | 1,452.2 | 1,364.7 | 1,282.4 |
| EBIT, % | 21.15 | 30.73 | 48.52 | 42.91 | 19.8 | 32.62 | 32.62 | 32.62 | 32.62 | 32.62 |
| Total Cash | 1,214.2 | 1,751.8 | 3,111.7 | 5,411.2 | 4,265.1 | 3,817.3 | 3,587.3 | 3,371.1 | 3,167.9 | 2,977.0 |
| Total Cash, percent | .0 | .0 | .0 | .0 | .0 | .0 | .0 | .0 | .0 | .0 |
| Account Receivables | 503.2 | 387.9 | 1,159.4 | 633.6 | 921.5 | 988.2 | 928.7 | 872.7 | 820.1 | 770.7 |
| Account Receivables, % | 39.44 | 16.2 | 14.42 | 10.78 | 17.18 | 19.61 | 19.61 | 19.61 | 19.61 | 19.61 |
| Inventories | 489.3 | 718.3 | 1,580.8 | 1,444.9 | 2,142.2 | 1,537.8 | 1,445.2 | 1,358.1 | 1,276.2 | 1,199.3 |
| Inventories, % | 38.36 | 30 | 19.66 | 24.59 | 39.94 | 30.51 | 30.51 | 30.51 | 30.51 | 30.51 |
| Accounts Payable | 144.0 | 187.0 | 271.9 | 252.9 | 554.0 | 374.1 | 351.6 | 330.4 | 310.5 | 291.8 |
| Accounts Payable, % | 11.29 | 7.81 | 3.38 | 4.3 | 10.33 | 7.42 | 7.42 | 7.42 | 7.42 | 7.42 |
| Capital Expenditure | -176.3 | -296.3 | -398.8 | -2,177.9 | -1,011.3 | -877.8 | -824.9 | -775.2 | -728.5 | -684.6 |
| Capital Expenditure, % | -13.82 | -12.38 | -4.96 | -37.07 | -18.85 | -17.42 | -17.42 | -17.42 | -17.42 | -17.42 |
| Tax Rate, % | 21.17 | 21.17 | 21.17 | 21.17 | 21.17 | 21.17 | 21.17 | 21.17 | 21.17 | 21.17 |
| EBITAT | 245.3 | 595.0 | 3,372.1 | 2,300.4 | 837.4 | 1,408.5 | 1,323.6 | 1,243.9 | 1,168.9 | 1,098.4 |
| Depreciation | ||||||||||
| Changes in Account Receivables | ||||||||||
| Changes in Inventories | ||||||||||
| Changes in Accounts Payable | ||||||||||
| Capital Expenditure | ||||||||||
| UFCF | -722.2 | 295.2 | 1,567.1 | 941.1 | -484.7 | 1,080.4 | 808.7 | 760.0 | 714.2 | 671.1 |
| WACC, % | 6.19 | 6.15 | 6.17 | 6.19 | 6.15 | 6.17 | 6.17 | 6.17 | 6.17 | 6.17 |
| PV UFCF | ||||||||||
| SUM PV UFCF | 3,429.7 | |||||||||
| Long Term Growth Rate, % | 0.50 | |||||||||
| Free cash flow (T + 1) | 674 | |||||||||
| Terminal Value | 11,897 | |||||||||
| Present Terminal Value | 8,820 | |||||||||
| Enterprise Value | 12,249 | |||||||||
| Net Debt | -2,243 | |||||||||
| Equity Value | 14,493 | |||||||||
| Diluted Shares Outstanding, MM | 721 | |||||||||
| Equity Value Per Share | 20.10 |
What You Will Receive
- Authentic Sinomine Data: Comprehensive financials – encompassing everything from revenue to EBIT – derived from real and projected figures.
- Complete Customization: Modify essential parameters (highlighted cells) such as WACC, growth %, and tax rates.
- Real-Time Valuation Adjustments: Automatic recalculations to evaluate the effect of changes on Sinomine Resource Group’s fair value.
- Flexible Excel Template: Designed for easy edits, scenario analysis, and in-depth forecasting.
- Efficient and Precise: Avoid the hassle of building models from the ground up while ensuring accuracy and adaptability.
Key Features
- Customizable Forecast Variables: Adjust essential inputs such as commodity prices, operational costs, and capital investments.
- Instant DCF Valuation: Quickly computes intrinsic value, NPV, and other financial metrics.
- Industry-Leading Precision: Utilizes Sinomine’s actual financial data for credible valuation results.
- Simplified Scenario Analysis: Effortlessly explore various assumptions and evaluate their impacts.
- Efficiency Booster: Streamlines the valuation process, removing the need for intricate model development.
How It Works
- Step 1: Download the Excel file.
- Step 2: Explore the pre-filled financial data and forecasts for Sinomine Resource Group Co., Ltd. (002738SZ).
- Step 3: Adjust key inputs such as revenue growth, WACC, and tax rates (highlighted cells).
- Step 4: Observe the DCF model update in real-time as you modify your assumptions.
- Step 5: Evaluate the outputs to inform your investment decisions.
Why Choose the Sinomine Resource Group Co., Ltd. Calculator?
- Save Time: Skip the hassle of building a DCF model from the ground up – it’s ready for immediate use.
- Enhance Accuracy: Dependable financial data and formulas minimize valuation errors.
- Completely Customizable: Adjust the model to represent your specific assumptions and forecasts.
- User-Friendly: Intuitive charts and outputs simplify result analysis.
- Preferred by Professionals: Developed for experts who prioritize precision and functionality.
Who Can Benefit from This Product?
- Finance Students: Explore valuation methods and practice them with actual market data.
- Researchers: Integrate established financial models into your academic studies or projects.
- Investors: Validate your investment hypotheses and assess the valuation metrics for Sinomine Resource Group Co., Ltd. (002738SZ).
- Financial Analysts: Enhance your efficiency with a ready-to-use, customizable DCF model.
- Entrepreneurs: Discover how major publicly traded companies like Sinomine Resource Group Co., Ltd. (002738SZ) undergo financial analysis.
Contents of the Template
- Pre-Filled Data: Featuring Sinomine Resource Group Co., Ltd.'s historical financial performance and forecasts.
- Discounted Cash Flow Model: An editable DCF valuation model with automatic calculations for [002738SZ].
- Weighted Average Cost of Capital (WACC): A dedicated worksheet for calculating WACC using customized inputs.
- Key Financial Ratios: Evaluate Sinomine’s profitability, efficiency, and capital structure.
- Customizable Inputs: Easily modify revenue growth rates, margins, and tax assumptions.
- Clear Dashboard: Visual representations and tables summarizing essential valuation outcomes.
Disclaimer
All information, articles, and product details provided on this website are for general informational and educational purposes only. We do not claim any ownership over, nor do we intend to infringe upon, any trademarks, copyrights, logos, brand names, or other intellectual property mentioned or depicted on this site. Such intellectual property remains the property of its respective owners, and any references here are made solely for identification or informational purposes, without implying any affiliation, endorsement, or partnership.
We make no representations or warranties, express or implied, regarding the accuracy, completeness, or suitability of any content or products presented. Nothing on this website should be construed as legal, tax, investment, financial, medical, or other professional advice. In addition, no part of this site—including articles or product references—constitutes a solicitation, recommendation, endorsement, advertisement, or offer to buy or sell any securities, franchises, or other financial instruments, particularly in jurisdictions where such activity would be unlawful.
All content is of a general nature and may not address the specific circumstances of any individual or entity. It is not a substitute for professional advice or services. Any actions you take based on the information provided here are strictly at your own risk. You accept full responsibility for any decisions or outcomes arising from your use of this website and agree to release us from any liability in connection with your use of, or reliance upon, the content or products found herein.