
|
MLS Co., Ltd (002745.sz) Valoración de DCF |
Completamente Editable: Adáptelo A Sus Necesidades En Excel O Sheets
Diseño Profesional: Plantillas Confiables Y Estándares De La Industria
Predeterminadas Para Un Uso Rápido Y Eficiente
Compatible con MAC / PC, completamente desbloqueado
No Se Necesita Experiencia; Fáciles De Seguir
MLS Co., Ltd (002745.SZ) Bundle
Diseñada para la precisión, nuestra calculadora DCF (002745SZ) le permite evaluar MLS Co., la valoración de LTD utilizando datos financieros reales y proporciona una flexibilidad completa para modificar todos los parámetros esenciales para las proyecciones mejoradas.
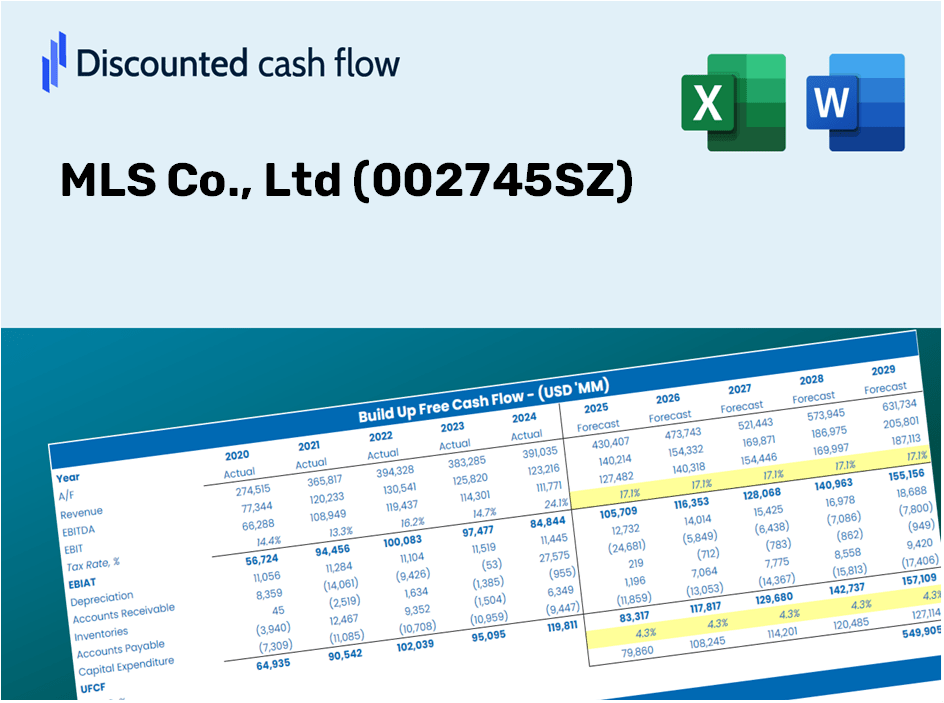
Discounted Cash Flow (DCF) - (USD MM)
| Year | AY1 2020 |
AY2 2021 |
AY3 2022 |
AY4 2023 |
AY5 2024 |
FY1 2025 |
FY2 2026 |
FY3 2027 |
FY4 2028 |
FY5 2029 |
|---|---|---|---|---|---|---|---|---|---|---|
| Revenue | 17,381.3 | 18,614.6 | 16,516.8 | 17,535.7 | 16,910.3 | 16,843.8 | 16,777.6 | 16,711.7 | 16,646.0 | 16,580.6 |
| Revenue Growth, % | 0 | 7.1 | -11.27 | 6.17 | -3.57 | -0.39296 | -0.39296 | -0.39296 | -0.39296 | -0.39296 |
| EBITDA | 1,345.7 | 2,871.8 | 1,235.0 | 1,667.4 | 1,445.2 | 1,640.7 | 1,634.2 | 1,627.8 | 1,621.4 | 1,615.0 |
| EBITDA, % | 7.74 | 15.43 | 7.48 | 9.51 | 8.55 | 9.74 | 9.74 | 9.74 | 9.74 | 9.74 |
| Depreciation | 1,020.5 | 1,088.2 | 919.0 | 831.3 | 836.8 | 908.6 | 905.0 | 901.4 | 897.9 | 894.4 |
| Depreciation, % | 5.87 | 5.85 | 5.56 | 4.74 | 4.95 | 5.39 | 5.39 | 5.39 | 5.39 | 5.39 |
| EBIT | 325.2 | 1,783.7 | 316.0 | 836.1 | 608.4 | 732.1 | 729.2 | 726.4 | 723.5 | 720.7 |
| EBIT, % | 1.87 | 9.58 | 1.91 | 4.77 | 3.6 | 4.35 | 4.35 | 4.35 | 4.35 | 4.35 |
| Total Cash | 6,425.2 | 5,556.5 | 3,957.7 | 4,675.5 | 4,097.7 | 4,772.6 | 4,753.9 | 4,735.2 | 4,716.6 | 4,698.1 |
| Total Cash, percent | .0 | .0 | .0 | .0 | .0 | .0 | .0 | .0 | .0 | .0 |
| Account Receivables | 6,776.3 | 4,956.5 | 4,482.5 | 4,594.2 | 4,828.3 | 4,969.1 | 4,949.5 | 4,930.1 | 4,910.7 | 4,891.4 |
| Account Receivables, % | 38.99 | 26.63 | 27.14 | 26.2 | 28.55 | 29.5 | 29.5 | 29.5 | 29.5 | 29.5 |
| Inventories | 2,594.8 | 3,958.3 | 3,974.4 | 3,442.7 | 3,413.4 | 3,371.2 | 3,358.0 | 3,344.8 | 3,331.7 | 3,318.6 |
| Inventories, % | 14.93 | 21.26 | 24.06 | 19.63 | 20.19 | 20.01 | 20.01 | 20.01 | 20.01 | 20.01 |
| Accounts Payable | 5,701.1 | 7,305.8 | 3,054.3 | 6,688.4 | 7,159.0 | 5,761.2 | 5,738.5 | 5,716.0 | 5,693.5 | 5,671.1 |
| Accounts Payable, % | 32.8 | 39.25 | 18.49 | 38.14 | 42.34 | 34.2 | 34.2 | 34.2 | 34.2 | 34.2 |
| Capital Expenditure | -1,695.6 | -883.2 | -519.2 | -562.1 | -1,083.9 | -918.3 | -914.7 | -911.1 | -907.5 | -903.9 |
| Capital Expenditure, % | -9.76 | -4.74 | -3.14 | -3.21 | -6.41 | -5.45 | -5.45 | -5.45 | -5.45 | -5.45 |
| Tax Rate, % | 36.8 | 36.8 | 36.8 | 36.8 | 36.8 | 36.8 | 36.8 | 36.8 | 36.8 | 36.8 |
| EBITAT | 127.9 | 1,334.2 | 253.0 | 549.2 | 384.6 | 473.1 | 471.2 | 469.4 | 467.5 | 465.7 |
| Depreciation | ||||||||||
| Changes in Account Receivables | ||||||||||
| Changes in Inventories | ||||||||||
| Changes in Accounts Payable | ||||||||||
| Capital Expenditure | ||||||||||
| UFCF | -4,217.3 | 3,600.1 | -3,140.8 | 4,872.5 | 403.2 | -1,033.1 | 471.6 | 469.8 | 467.9 | 466.1 |
| WACC, % | 6.23 | 6.7 | 6.77 | 6.58 | 6.55 | 6.56 | 6.56 | 6.56 | 6.56 | 6.56 |
| PV UFCF | ||||||||||
| SUM PV UFCF | 536.1 | |||||||||
| Long Term Growth Rate, % | 3.00 | |||||||||
| Free cash flow (T + 1) | 480 | |||||||||
| Terminal Value | 13,467 | |||||||||
| Present Terminal Value | 9,799 | |||||||||
| Enterprise Value | 10,335 | |||||||||
| Net Debt | -3,441 | |||||||||
| Equity Value | 13,776 | |||||||||
| Diluted Shares Outstanding, MM | 1,484 | |||||||||
| Equity Value Per Share | 9.28 |
What You Will Receive
- Pre-Filled Financial Model: Utilize MLS Co., Ltd's actual data for accurate DCF valuation.
- Comprehensive Forecast Control: Modify revenue growth, profit margins, WACC, and other crucial factors.
- Real-Time Calculations: Enjoy automatic updates that reflect changes instantly.
- Professional-Grade Template: A polished Excel file crafted for serious valuation purposes.
- Customizable and Reusable: Designed for versatility, enabling repeated application for in-depth forecasts.
Key Features
- Genuine MLS Co. Financial Data: Gain access to reliable historical records and projections for the future.
- Adjustable Forecast Assumptions: Customize highlighted cells, including WACC, growth rates, and profit margins.
- Real-Time Calculations: Automatic adjustments for DCF, Net Present Value (NPV), and cash flow analysis.
- User-Friendly Dashboard: Clear charts and summaries to help you visualize your valuation outcomes.
- Suitable for All Levels: Designed with simplicity in mind for investors, CFOs, and consultants alike.
How It Works
- 1. Access the Template: Download and open the Excel file featuring MLS Co., Ltd's preloaded data.
- 2. Adjust Key Inputs: Modify essential variables such as growth rates, WACC, and capital expenditures.
- 3. Get Immediate Results: The DCF model will automatically compute intrinsic value and NPV in real-time.
- 4. Explore Different Scenarios: Analyze various forecasts to evaluate diverse valuation results.
- 5. Make Informed Decisions: Utilize professional valuation insights to bolster your decision-making process.
Reasons to Select the MLS Co., Ltd Calculator
- Precision: Data derived from actual MLS Co., Ltd (002745SZ) financials guarantees reliability.
- Adaptability: Built to allow users to experiment with and adjust inputs as needed.
- Efficiency: Eliminate the need to create a DCF model from the ground up.
- Expert-Level: Crafted with the accuracy and functionality expected at a CFO level.
- Intuitive: Simple to navigate, making it accessible for users without extensive financial modeling expertise.
Who Can Benefit from MLS Co., Ltd (002745SZ)?
- Investors: Gain confidence in your investment choices with our expert valuation tool.
- Financial Analysts: Streamline your workflow with our customizable, pre-built DCF model.
- Consultants: Effortlessly tailor the template for impactful client presentations or reports.
- Finance Enthusiasts: Enhance your grasp of valuation methods through real-world applications.
- Educators and Students: Leverage this resource as a hands-on learning aid for finance courses.
Overview of Template Features
- In-Depth DCF Model: A customizable template offering extensive valuation calculations.
- Real-World Financial Data: Historical and forecasted financials for MLS Co., Ltd (002745SZ) preloaded for your analysis.
- Adjustable Assumptions: Modify WACC, growth rates, and tax estimates to explore different scenarios.
- Financial Statements: Detailed annual and quarterly reports for enhanced understanding.
- Essential Ratios: Integrated analysis for assessing profitability, efficiency, and leverage.
- Interactive Dashboard: Visual outputs including charts and tables for straightforward, actionable insights.
Disclaimer
All information, articles, and product details provided on this website are for general informational and educational purposes only. We do not claim any ownership over, nor do we intend to infringe upon, any trademarks, copyrights, logos, brand names, or other intellectual property mentioned or depicted on this site. Such intellectual property remains the property of its respective owners, and any references here are made solely for identification or informational purposes, without implying any affiliation, endorsement, or partnership.
We make no representations or warranties, express or implied, regarding the accuracy, completeness, or suitability of any content or products presented. Nothing on this website should be construed as legal, tax, investment, financial, medical, or other professional advice. In addition, no part of this site—including articles or product references—constitutes a solicitation, recommendation, endorsement, advertisement, or offer to buy or sell any securities, franchises, or other financial instruments, particularly in jurisdictions where such activity would be unlawful.
All content is of a general nature and may not address the specific circumstances of any individual or entity. It is not a substitute for professional advice or services. Any actions you take based on the information provided here are strictly at your own risk. You accept full responsibility for any decisions or outcomes arising from your use of this website and agree to release us from any liability in connection with your use of, or reliance upon, the content or products found herein.